Label the axes and phases on the business cycle graph.
Understand the Problem
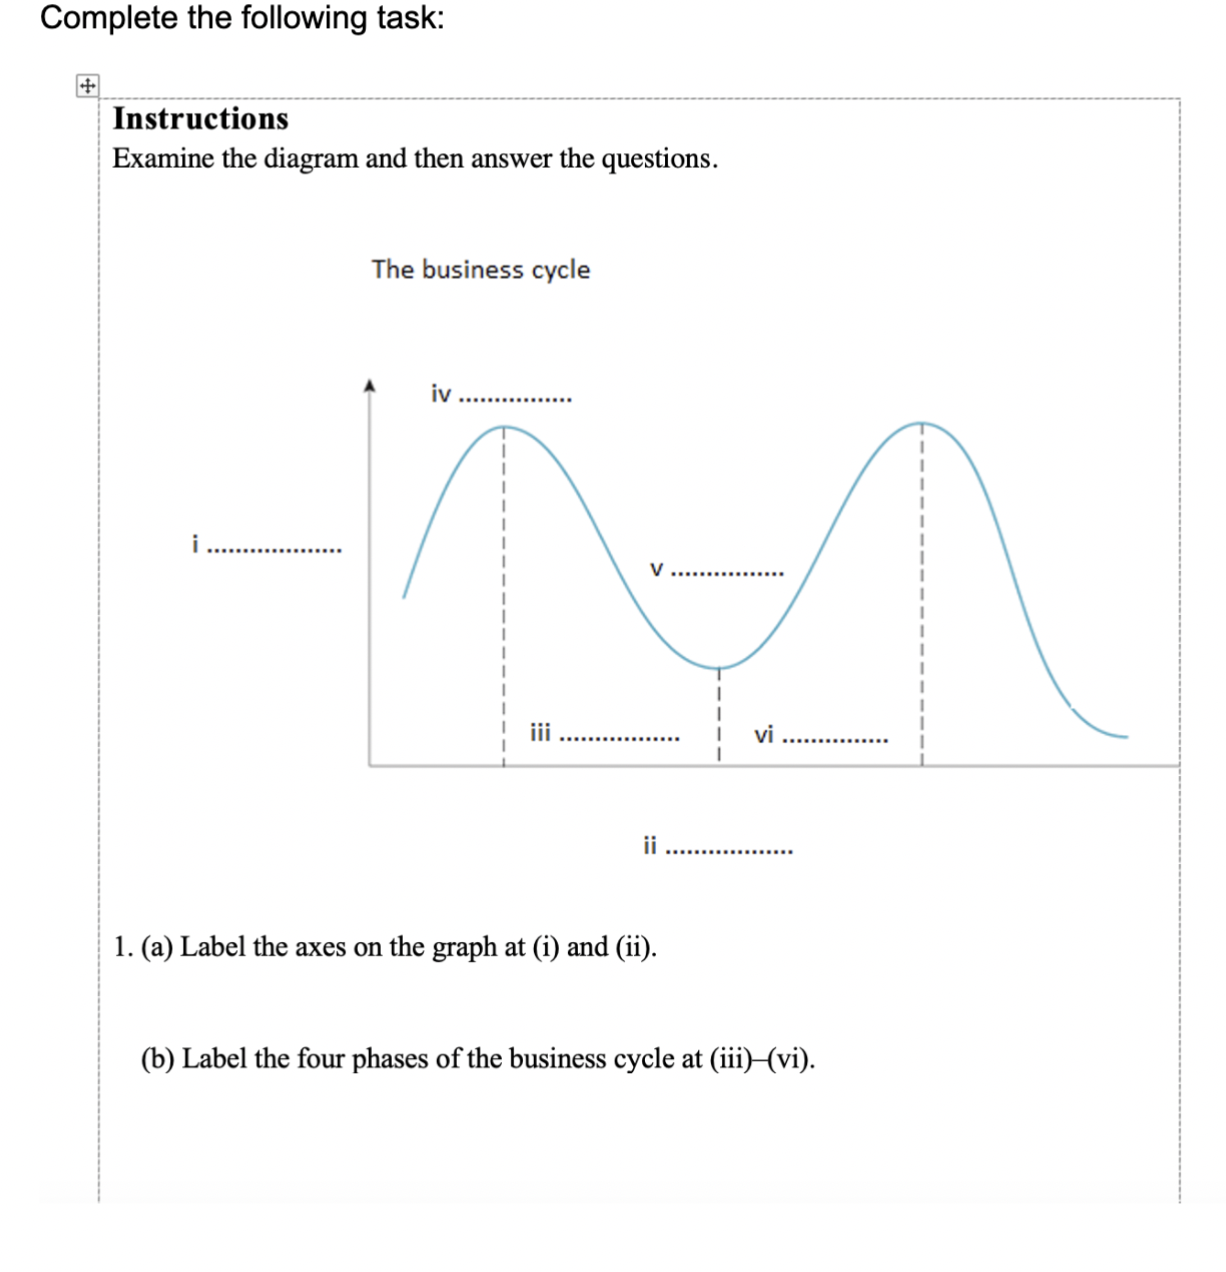
The prompt is asking the user to label the axes of the provided business cycle graph, and label the phases of the business cycle.
Answer
The vertical axis is Real GDP, and the horizontal axis is Time. The phases are Expansion, Peak, Contraction, and Trough.
Here are the labels for the business cycle graph: (i) Real GDP (or Output or General Price Level) (ii) Time (iii) Expansion (iv) Peak (v) Contraction (Recession) (vi) Trough
Answer for screen readers
Here are the labels for the business cycle graph: (i) Real GDP (or Output or General Price Level) (ii) Time (iii) Expansion (iv) Peak (v) Contraction (Recession) (vi) Trough
More Information
The business cycle illustrates the fluctuations in economic activity over a period. It is typically measured using real Gross Domestic Product (GDP).
Tips
A common mistake is confusing the axes. The vertical axis represents economic activity, while the horizontal axis represents time.
Sources
- Business Cycle Graph - Economics Online - economicsonline.co.uk
- The Four Stages of Business Cycles - Guidant Financial - guidantfinancial.com
- Reading: Phases of the Business Cycle | Macroeconomics | - coursesidekick.com
AI-generated content may contain errors. Please verify critical information