Explain the Nifty 50 intraday key levels chart for 21.02.25.
Understand the Problem
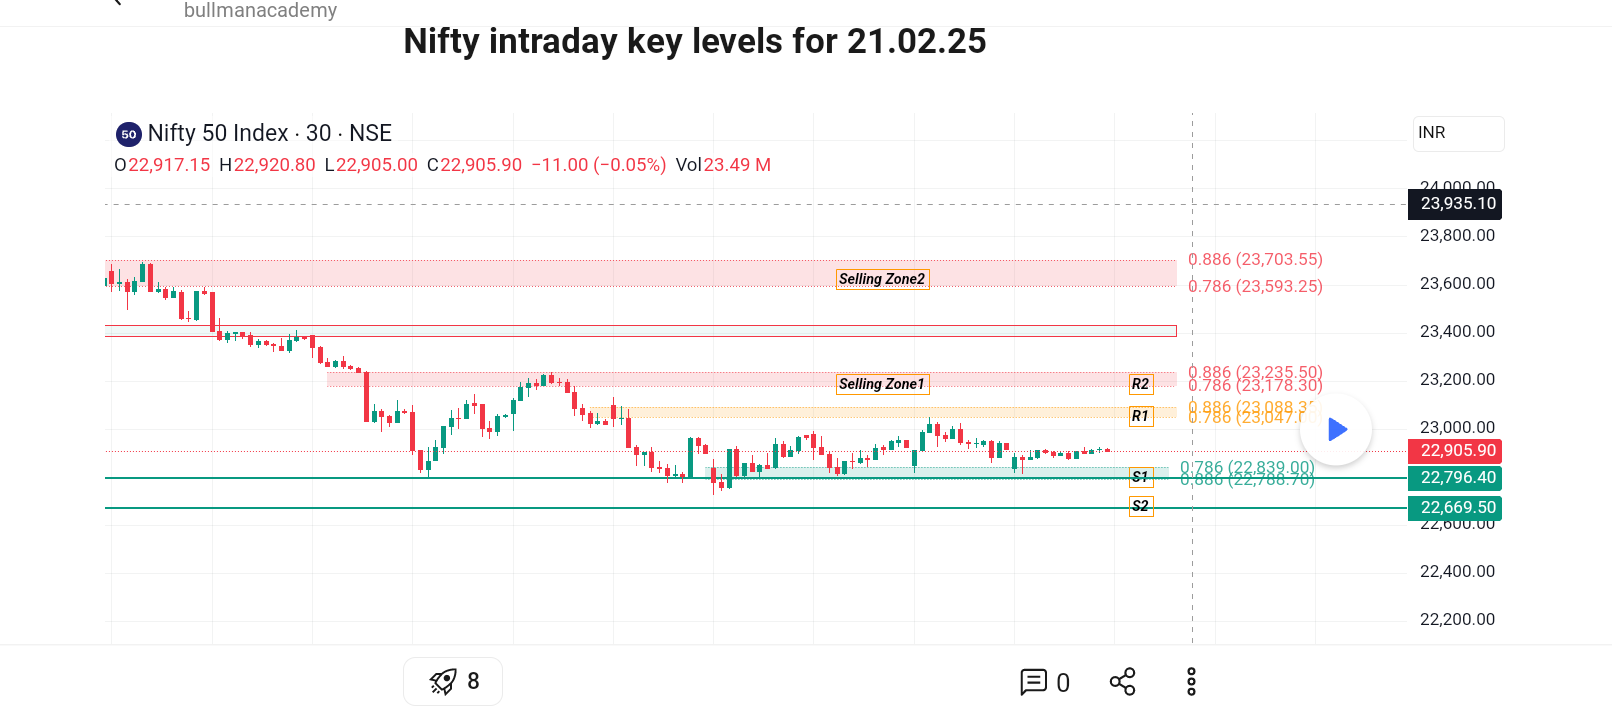
The image shows a trading chart for Nifty 50 Index, displaying intraday key levels for 21.02.25. It highlights selling zones, resistance levels (R1, R2), and support levels (S1, S2), along with Fibonacci retracement levels. It is likely that the user wants an explanation or analysis of the chart or assistance in understanding its components.
Answer
Key levels for Nifty on 21.02.25 include resistance levels at 23,047.10 and 23,178.30, support levels at 22,839.00 and 22,766.70, and selling zones at 23,235.50-23,358.30 and 23,593.25-23,703.55.
The Nifty intraday key levels for 21.02.25 are:
- Resistance 1 (R1): 23,047.10
- Resistance 2 (R2): 23,178.30
- Support 1 (S1): 22,839.00
- Support 2 (S2): 22,766.70
- Selling Zone 1: 23,235.50 - 23,358.30
- Selling Zone 2: 23,593.25 - 23,703.55
Answer for screen readers
The Nifty intraday key levels for 21.02.25 are:
- Resistance 1 (R1): 23,047.10
- Resistance 2 (R2): 23,178.30
- Support 1 (S1): 22,839.00
- Support 2 (S2): 22,766.70
- Selling Zone 1: 23,235.50 - 23,358.30
- Selling Zone 2: 23,593.25 - 23,703.55
More Information
Resistance levels are price levels where the price tends to stop increasing, while support levels are price levels where the price tends to stop decreasing. Selling zones are price ranges where there is likely to be strong selling pressure.
Tips
Recognizing support and resistance levels can be subjective, as different traders may identify slightly different levels based on their own analysis and trading styles.
Sources
- Nifty 50 prediction today - Enrich Money - enrichmoney.in
- Ideas and Forecasts on Indices - TradingView - in.tradingview.com
- Trade setup for February 21: Top 15 things to know before the ... - moneycontrol.com
AI-generated content may contain errors. Please verify critical information