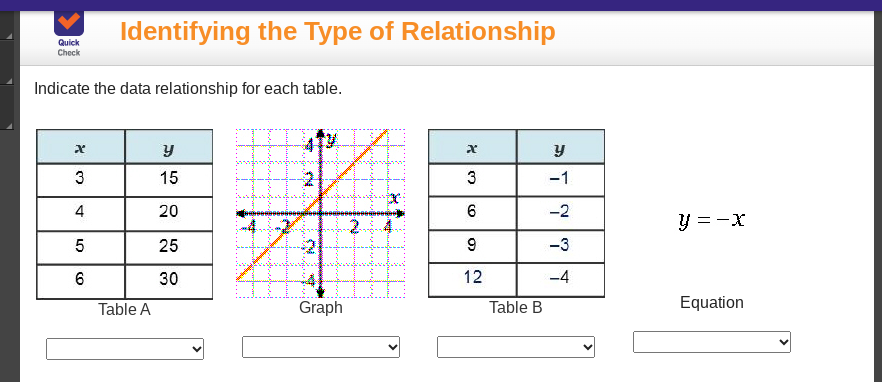
Indicate the data relationship for each table: Table A, Graph, Table B, and Equation.
Understand the Problem
The question is asking to identify the type of relationship represented by the data in the given tables, the graph, and the equation. This involves analyzing the provided tables of values, the visual representation in the graph, and the mathematical equation to categorize the relationships.
Answer
Table A: Linear ($y = 5x$), Table B: Linear ($y = -\frac{1}{3}x$), Graph: Positive Linear, Equation: Linear ($y = -x$).
Answer for screen readers
- Table A: Linear relationship with the equation $y = 5x$.
- Table B: Linear relationship with the equation $y = -\frac{1}{3}x$.
- Graph: Positive linear relationship.
- Equation: Linear relationship with the equation $y = -x$.
Steps to Solve
- Analyze Table A Examine the values in Table A:
\[
\begin{array}{|c|c|}
\hline
x & y \\
\hline
3 & 15 \\
4 & 20 \\
5 & 25 \\
6 & 30 \\
\hline
\end{array}
\]
For each increase of 1 in $x$, $y$ increases by 5. The relationship seems linear.
- Identify the equation for Table A The pattern suggests a linear equation. We can identify it as follows:
- The slope ($m$) is 5 (change in $y$ over change in $x$).
- Using the equation $y = mx + b$, and knowing one point (3, 15), we can substitute: $$ 15 = 5(3) + b $$ $$ 15 = 15 + b \implies b = 0 $$ Thus, the equation is $y = 5x$.
-
Analyze the Graph The graph shows a line passing through the origin, indicating a positive linear relationship.
-
Analyze Table B Examine the values in Table B:
\[
\begin{array}{|c|c|}
\hline
x & y \\
\hline
3 & -1 \\
6 & -2 \\
9 & -3 \\
12 & -4 \\
\hline
\end{array}
\]
Here, as $x$ increases by 3, $y$ decreases by 1, suggesting a linear relationship with a negative slope.
-
Identify the equation for Table B Using the same method, the slope ($m$) is $-\frac{1}{3}$. Using point (3, -1): $$-1 = -\frac{1}{3}(3) + b $$ $$-1 = -1 + b \implies b = 0 $$ Thus, the equation is $y = -\frac{1}{3}x$.
-
Examine the provided equation The equation given is $y = -x$. This represents another linear relationship with a slope of -1.
- Table A: Linear relationship with the equation $y = 5x$.
- Table B: Linear relationship with the equation $y = -\frac{1}{3}x$.
- Graph: Positive linear relationship.
- Equation: Linear relationship with the equation $y = -x$.
More Information
All identified relationships in the tables, graph, and equation are linear. The linearity indicates a constant rate of change, which can be modeled by equations of the form $y = mx + b$.
Tips
- Misinterpreting the slope: Ensure to accurately calculate the change in $y$ over the change in $x$.
- Failing to identify the correct type of relationship: Always check a few data points to confirm linearity before concluding.
AI-generated content may contain errors. Please verify critical information