Gráfica de Transferencia Vin vs Vout
Understand the Problem
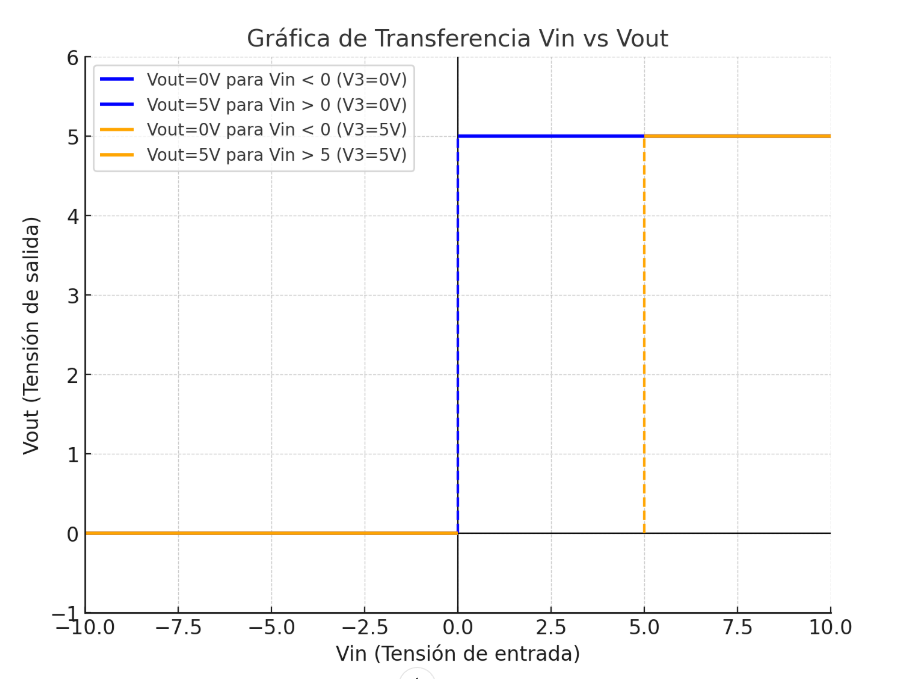
La pregunta está relacionada con la interpretación de un gráfico de transferencia que muestra la relación entre la tensión de entrada (Vin) y la tensión de salida (Vout) en un circuito eléctrico.
Answer
Piecewise linear function with thresholds at Vin = 0 and Vin = 5.
The graph shows a piecewise linear transfer function of Vin vs Vout. For Vin < 0, Vout = 0V or 5V depending on the case (V3 = 0V or 5V). For Vin > 0 or Vin > 5, Vout = 0V or 5V. It represents different output states based on input voltage thresholds.
Answer for screen readers
The graph shows a piecewise linear transfer function of Vin vs Vout. For Vin < 0, Vout = 0V or 5V depending on the case (V3 = 0V or 5V). For Vin > 0 or Vin > 5, Vout = 0V or 5V. It represents different output states based on input voltage thresholds.
More Information
This type of graph is useful in digital electronics where binary states (i.e., 0V and 5V) correspond to logical levels. The graph shows how output voltage switches based on input voltage thresholds.
Tips
Confusing the conditions (Vin thresholds) can lead to incorrect interpretation. Ensure the correct understanding of each segment.
Sources
- Please help me find the Vin vs Vout graph.... can't understand - forum.allaboutcircuits.com
AI-generated content may contain errors. Please verify critical information