Calculate the median value of the following data-set using a graphic technique: Size: 0-10, 10-20, 20-30, 30-40, 40-50, 50-60 Frequency: 3, 10, 20, 7, 6, 4 Graph the following dat... Calculate the median value of the following data-set using a graphic technique: Size: 0-10, 10-20, 20-30, 30-40, 40-50, 50-60 Frequency: 3, 10, 20, 7, 6, 4 Graph the following data in the form of 'less than' and 'more than' ogives, and calculate the median value through the graph: Marks: 0-5, 5-10, 10-15, 15-20, 20-25, 25-30, 30-35, 35-40 Number of Students: 7, 10, 20, 13, 17, 10, 14, 9
Understand the Problem
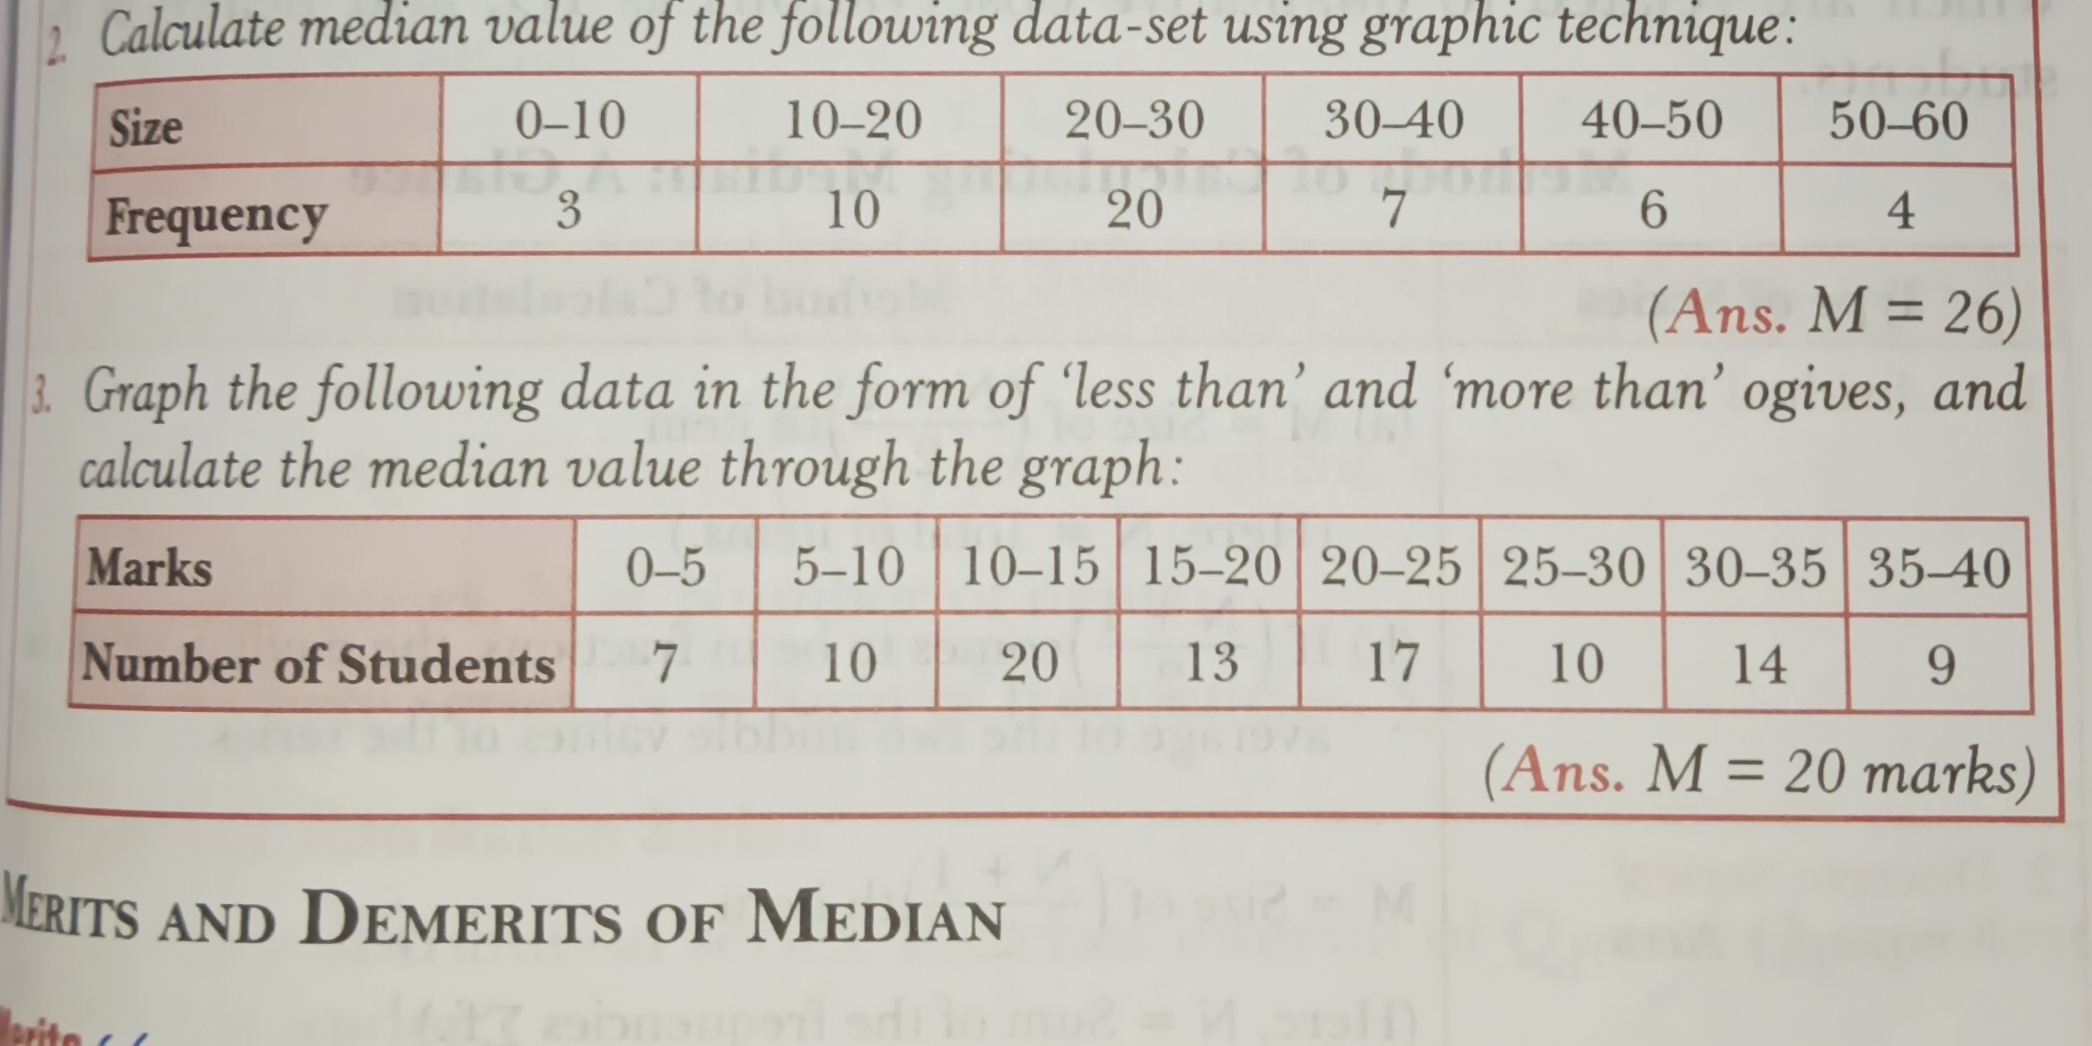
The image contains two questions related to statistics. The first question requires calculating the median value of a given data set using a graphic technique. The second question involves graphing data in the form of 'less than' and 'more than' ogives to find the median value graphically.
Answer
2. $M = 26$ 3. $M = 20$ marks
Answer for screen readers
- The median value is approximately $26$.
- The median value is approximately $20$ marks.
Steps to Solve
- Calculate cumulative frequencies for question 2
To find the median graphically, we first need to calculate the cumulative frequencies for the given data:
Size: 0-10, 10-20, 20-30, 30-40, 40-50, 50-60
Frequency: 3, 10, 20, 7, 6, 4
Cumulative Frequency (cf): 3, 13, 33, 40, 46, 50
- Plot the "less than" ogive for question 2
The "less than" ogive is formed by plotting the upper limit of each class interval against its corresponding cumulative frequency.
Points to plot: (10, 3), (20, 13), (30, 33), (40, 40), (50, 46), (60, 50)
Draw a smooth curve through these points.
- Determine the median position for question 2
The total frequency $N$ is 50. The median is the value corresponding to $N/2 = 50/2 = 25$.
- Locate the median on the graph for question 2
Find 25 on the cumulative frequency (y-axis). Draw a horizontal line from 25 to the ogive curve. From the point where it intersects the curve, drop a vertical line to the x-axis (Size). The point where this line intersects the x-axis is the median value. Based on the description it equals approximately 26.
- Calculate cumulative frequencies for "less than" ogive for question 3
To construct the "less than" ogive, calculate the cumulative frequencies: Marks: 0-5, 5-10, 10-15, 15-20, 20-25, 25-30, 30-35, 35-40 Frequency: 7, 10, 20, 13, 17, 10, 14, 9 Cumulative Frequency (less than): 7, 17, 37, 50, 67, 77, 91, 100
- Plot the "less than" ogive for question 3
Plot the upper class limits against the cumulative frequencies: Points to plot: (5, 7), (10, 17), (15, 37), (20, 50), (25, 67), (30, 77), (35, 91), (40, 100) Draw a smooth curve through these points.
- Calculate cumulative frequencies for "more than" ogive for question 3
To construct the "more than" ogive, calculate the cumulative frequencies from the highest class interval: Marks: 0-5, 5-10, 10-15, 15-20, 20-25, 25-30, 30-35, 35-40 Frequency: 7, 10, 20, 13, 17, 10, 14, 9 Cumulative Frequency (more than): 100, 93, 83, 63, 50, 33, 23, 9
- Plot the "more than" ogive for question 3
Plot the lower class limits against the cumulative frequencies: Points to plot: (0, 100), (5, 93), (10, 83), (15, 63), (20, 50), (25, 33), (30, 23), (35, 9) Draw a smooth curve through these points.
- Determine the median from the intersection for question 3
The median is the x-coordinate of the point where the "less than" and "more than" ogives intersect. This approximately equals 20.
- The median value is approximately $26$.
- The median value is approximately $20$ marks.
More Information
The graphical method for finding the median involves plotting ogives (cumulative frequency curves) and locating the median based on the graph. For "less than" ogives, the median is found at $N/2$ on the cumulative frequency axis. When "less than" and "more than" ogives are plotted on the same graph, their intersection point gives the median value directly on the x-axis.
Tips
A common mistake is inaccurately plotting the points or drawing the ogive curves, which leads to an incorrect graphical estimation of the median. Another mistake is confusing the upper and lower limits for "less than" and "more than" ogives. Ensure accurate plotting and clear distinction between the two types of ogives.
AI-generated content may contain errors. Please verify critical information