Calculate the mean and standard deviation for data in the table.
Understand the Problem
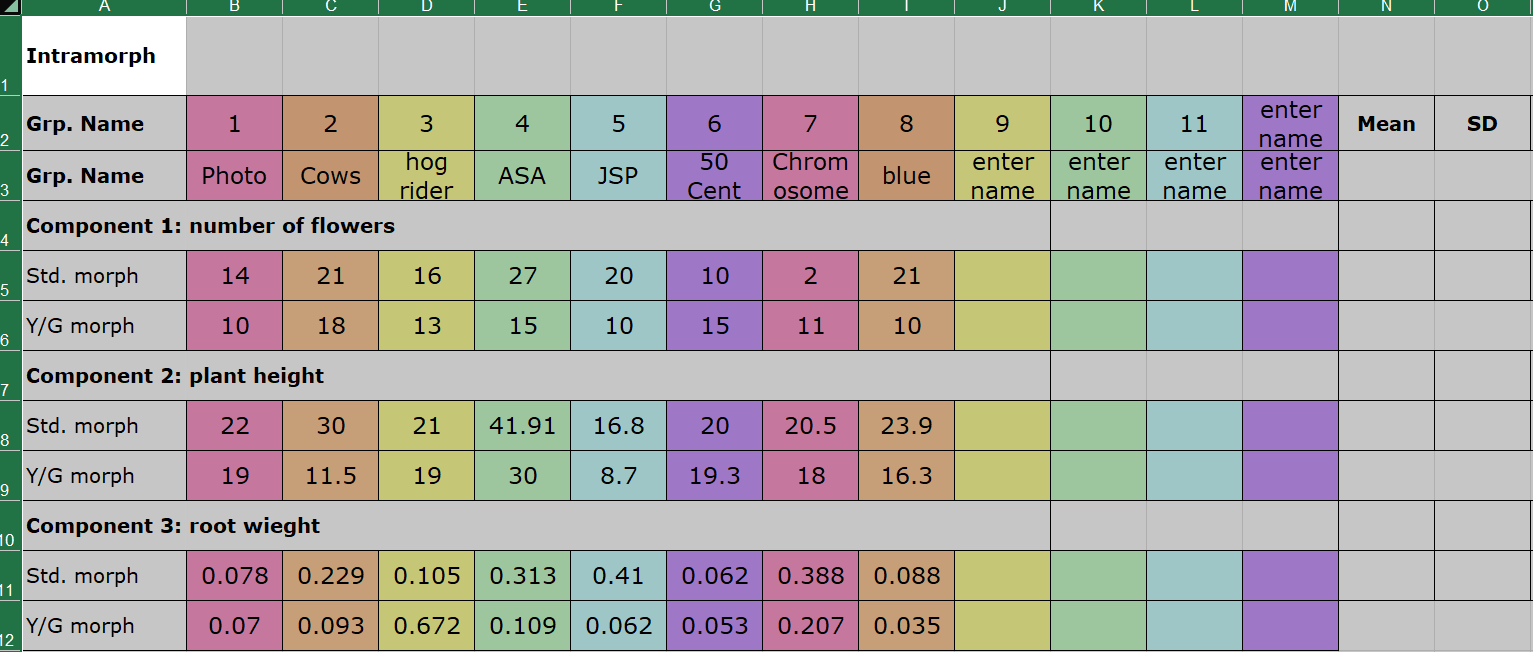
The image contains a table with data comparing two types of plant morphs (Std. morph and Y/G morph) across three components: number of flowers, plant height, and root weight. The question is likely asking to calculate the mean and standard deviation of these measurements but it's incomplete.
Answer
To calculate the mean and standard deviation, I would need to perform calculations on the data provided in the table.
To provide the mean and standard deviation, I would need to perform calculations on the data provided. Specifically, each row of data (e.g., 'Std. morph' and 'Y/G morph' for each component) would need to be analyzed separately to determine these statistics.
Answer for screen readers
To provide the mean and standard deviation, I would need to perform calculations on the data provided. Specifically, each row of data (e.g., 'Std. morph' and 'Y/G morph' for each component) would need to be analyzed separately to determine these statistics.
More Information
The mean is the average of a set of numbers. The standard deviation measures the spread of the data around the mean.
Tips
Ensure you are using the correct formula for standard deviation (population vs. sample).
Sources
- Standard Deviation Calculator - calculatorsoup.com
- 2. Mean and standard deviation - The BMJ - bmj.com
- 3: Mean and Standard Deviation from a Frequency Table - stats.libretexts.org
AI-generated content may contain errors. Please verify critical information