Analyze the following table which shows the worker population ratio in India for the year 2017-2018.
Understand the Problem
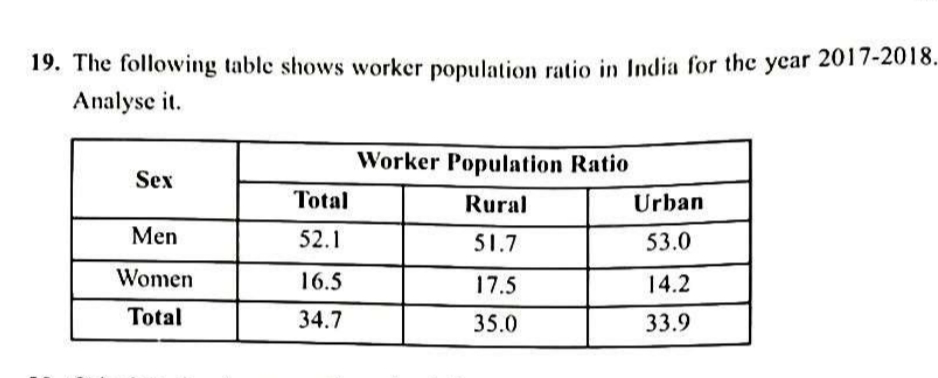
The question provides a table showing the worker population ratio in India for the year 2017-2018, broken down by sex (Men and Women) and location (Total, Rural, and Urban). The task is to analyze the data presented in the table and interpret the meaning of these ratios.
Answer
Men have a higher worker population ratio than women. Men's ratio is higher in urban areas, while women's is higher in rural areas.
The worker population ratio for men is significantly higher than for women in both rural and urban areas. For men, the worker population ratio is slightly higher in urban areas (53.0) compared to rural areas (51.7). For women, the worker population ratio is higher in rural areas (17.5) compared to urban areas (14.2).
Answer for screen readers
The worker population ratio for men is significantly higher than for women in both rural and urban areas. For men, the worker population ratio is slightly higher in urban areas (53.0) compared to rural areas (51.7). For women, the worker population ratio is higher in rural areas (17.5) compared to urban areas (14.2).
More Information
The worker population ratio is the percentage of the population that is employed. It is an important indicator of the labor market and the overall health of the economy. The data is sourced from the Periodic Labour Force Survey (PLFS) 2017-18.
Tips
Pay close attention to the units and categories in the table. Remember that the worker population ratio is a percentage, so focus on relative comparisons rather than absolute numbers.
Sources
AI-generated content may contain errors. Please verify critical information