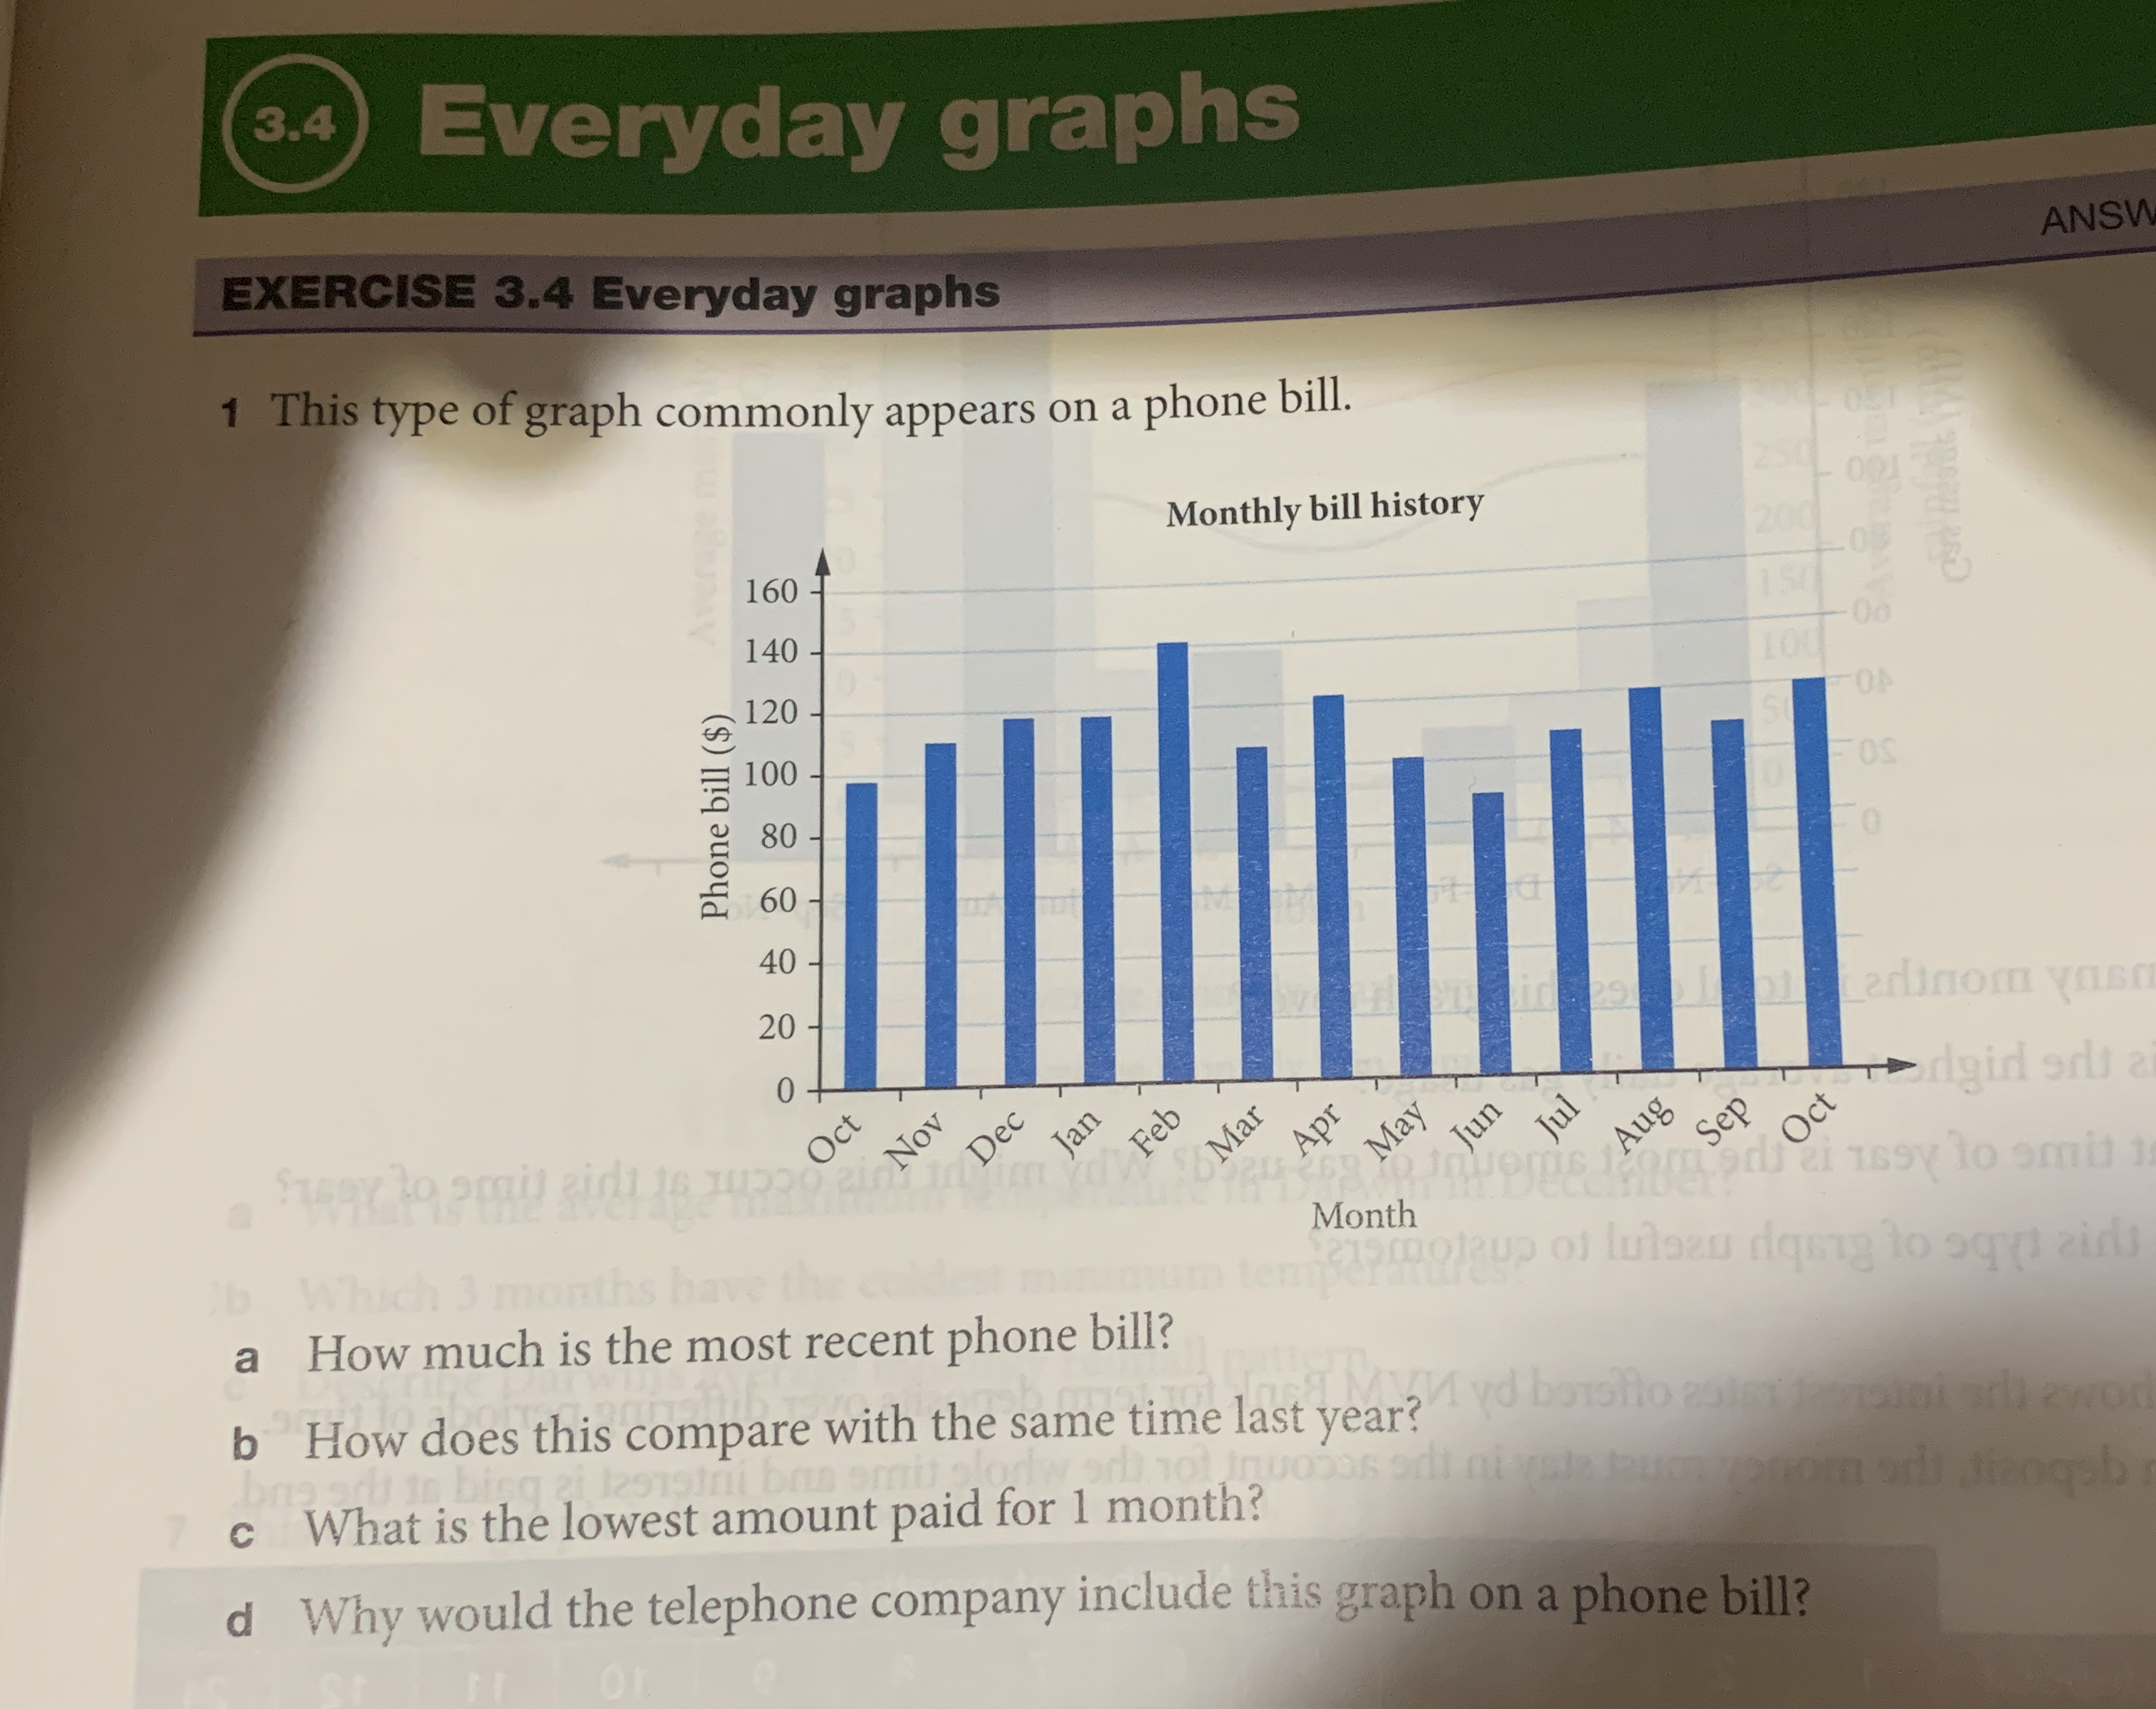
a. How much is the most recent phone bill? b. How does this compare with the same time last year? c. What is the lowest amount paid for 1 month? d. Why would the telephone company... a. How much is the most recent phone bill? b. How does this compare with the same time last year? c. What is the lowest amount paid for 1 month? d. Why would the telephone company include this graph on a phone bill?
Understand the Problem
These questions relate to interpreting data from the provided bar graph of monthly phone bills. Specifically, it asks to identify the most recent bill amount, compare it to the prior year, find the lowest bill amount, and consider why the phone company might include this graph on a bill.
Answer
a. $110 b. $10 more than last year c. $80 d. To show billing history and promote transparency.
Answer for screen readers
a. The most recent phone bill is approximately $110. b. It is $10 more than the same time last year ($100). c. The lowest amount paid for 1 month is $80. d. The telephone company might include this graph on a phone bill to show customers their billing history, promote transparency, and to verify the expenses.
Steps to Solve
- Find the amount of the most recent phone bill
The most recent month on the graph is October. Find the bar corresponding to October and read the value from the y-axis to determine the bill amount. The bar for October reaches approximately $110.
- Compare the most recent bill to the same time last year
Compare the October this year to the October of the prior year on the graph.
The most recent bill (this year) is $110 and the bill for October of last year is approximately $100. This year's October bill is higher than last year's October bill. Calculate the difference: $110 - $100 = $10. The most recent bill is $10 more than the same time last year.
- Find the lowest amount paid for 1 month
Scan the graph to find the shortest bar, which represents the lowest bill amount. The shortest bar corresponds to the month of June. Read the value from the y-axis to find the amount.
The lowest bill of $80 was in June.
- Reason for including the graph on a phone bill
Consider why a telephone company would include a graph like this on a customer's bill. A bill history graph provides transparency, helping customers understand their spending patterns over time which can lead to increased customer satisfaction and fewer billing inquiries. It also allows the customer to verify the expenses.
a. The most recent phone bill is approximately $110. b. It is $10 more than the same time last year ($100). c. The lowest amount paid for 1 month is $80. d. The telephone company might include this graph on a phone bill to show customers their billing history, promote transparency, and to verify the expenses.
More Information
Bar graphs are useful for visually comparing different data points or tracking changes over time. In this case, the phone company uses a bar graph to show the customer's monthly billing history.
Tips
Null
AI-generated content may contain errors. Please verify critical information