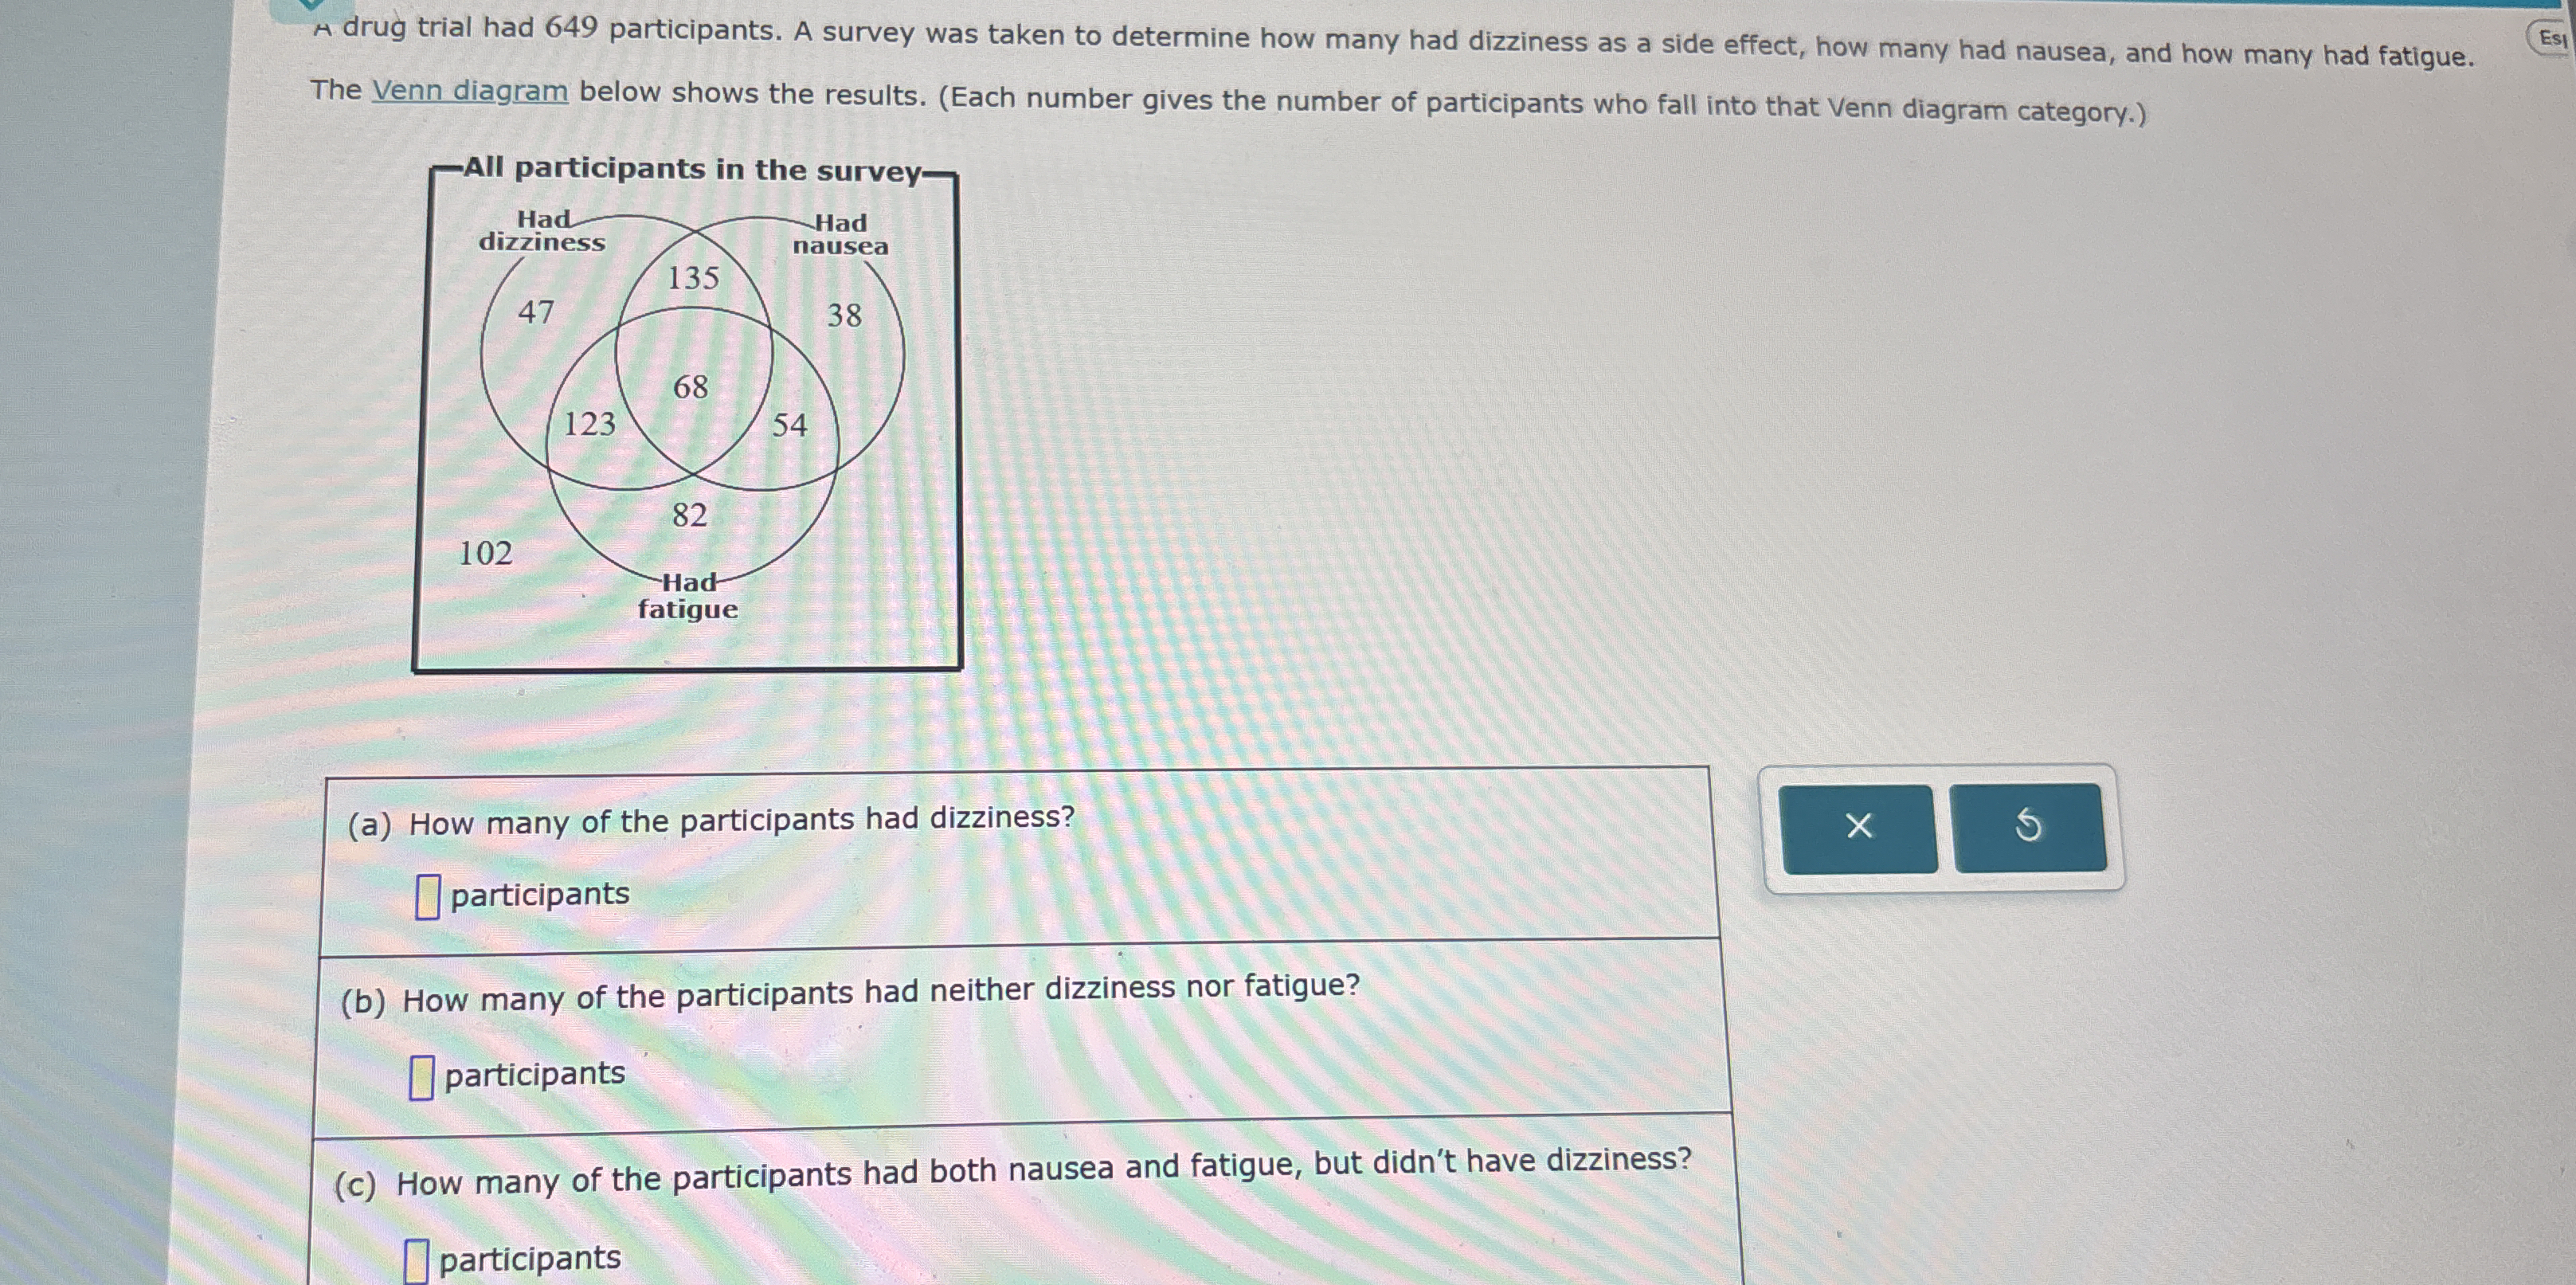
A drug trial had 649 participants. A survey was taken to determine how many had dizziness as a side effect, how many had nausea, and how many had fatigue. The Venn diagram below sh... A drug trial had 649 participants. A survey was taken to determine how many had dizziness as a side effect, how many had nausea, and how many had fatigue. The Venn diagram below shows the results. (Each number gives the number of participants who fall into that Venn diagram category.) (a) How many of the participants had dizziness? (b) How many of the participants had neither dizziness nor fatigue? (c) How many of the participants had both nausea and fatigue, but didn't have dizziness?
Understand the Problem
The questions are about interpreting a Venn diagram that represents the results of a survey regarding side effects (dizziness, nausea, and fatigue) experienced by participants in a drug trial. We need to extract specific numbers from the Venn diagram to answer each question accurately.
Answer
(a) 373 (b) 38 (c) 54
Answer for screen readers
(a) 373 participants (b) 38 participants (c) 54 participants
Steps to Solve
-
Participants with Dizziness To find the number of participants who had dizziness, we need to add all the numbers within the "dizziness" circle in the Venn diagram. This includes those who had only dizziness, dizziness and nausea, dizziness and fatigue, and all three symptoms. $47 + 135 + 68 + 123 = 373$
-
Participants with Neither Dizziness Nor Fatigue To find the number of participants who had neither dizziness nor fatigue, we look for the number outside of both the "dizziness" and "fatigue" circles. In the Venn diagram, this area only includes those who only experienced nausea. Therefore we include 38.
-
Participants with Nausea and Fatigue, but not Dizziness To find the number of participants who had both nausea and fatigue, but didn't have dizziness, we look for the intersection of the nausea and fatigue circles, excluding the portion that also intersects with the dizziness circle. This region is represented by the number 54.
(a) 373 participants (b) 38 participants (c) 54 participants
More Information
Venn diagrams are a useful tool for visually representing sets and their relationships, making it easier to understand overlaps and differences between groups.
Tips
A common mistake is to only add the number that represents those who only had the specified condition (e.g., dizziness). It's important to include all numbers within the relevant circles or intersections. Another mistake is misidentifying the region of the Venn diagram that corresponds to the question being asked.
AI-generated content may contain errors. Please verify critical information