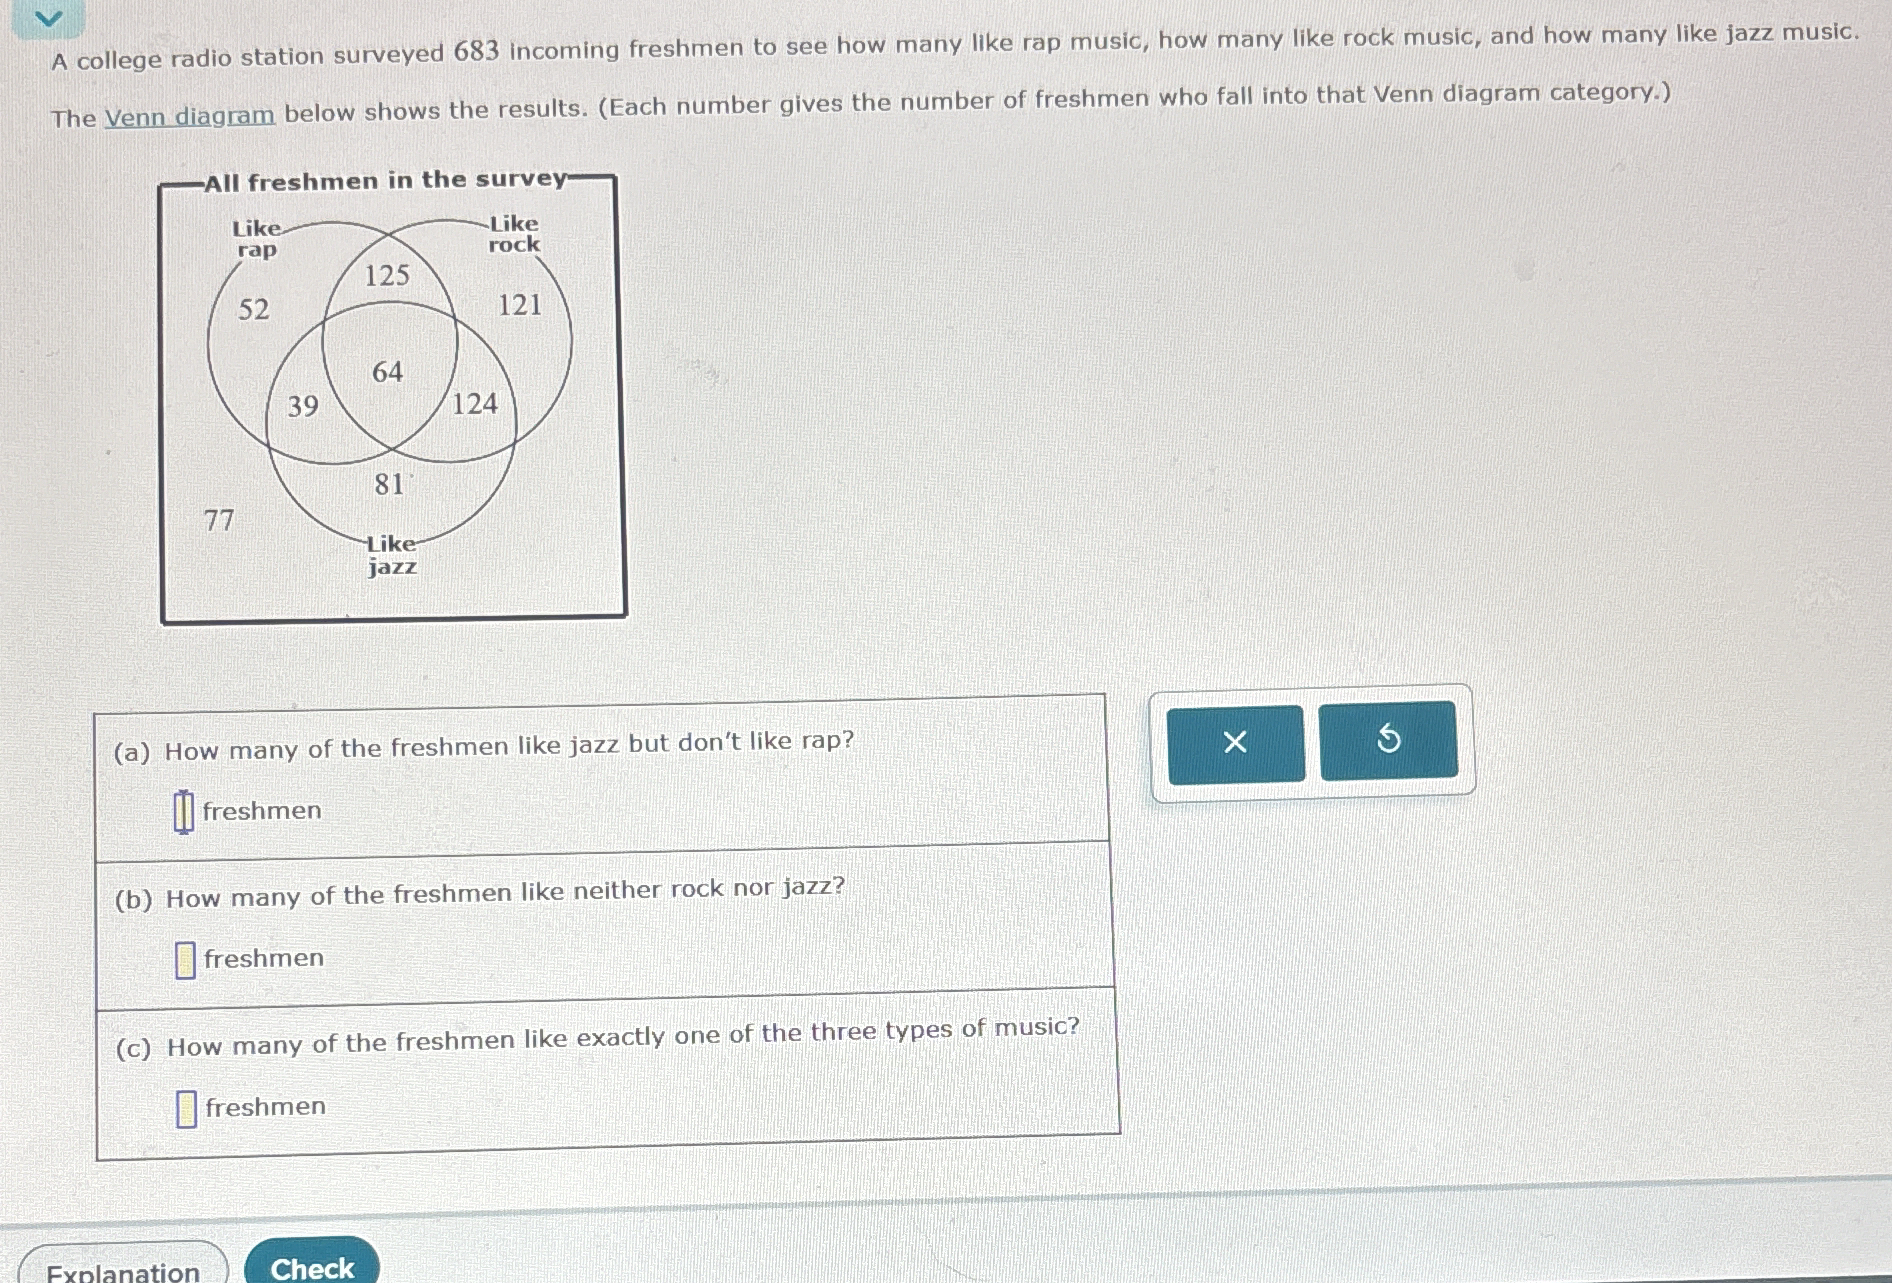
A college radio station surveyed 683 incoming freshmen to see how many like rap music, how many like rock music, and how many like jazz music. The Venn diagram below shows the resu... A college radio station surveyed 683 incoming freshmen to see how many like rap music, how many like rock music, and how many like jazz music. The Venn diagram below shows the results. (Each number gives the number of freshmen who fall into that Venn diagram category.) (a) How many of the freshmen like jazz but don't like rap? (b) How many of the freshmen like neither rock nor jazz? (c) How many of the freshmen like exactly one of the three types of music?
Understand the Problem
The questions ask to use the Venn diagram to determine how many freshmen like jazz but not rap, how many like neither rock nor jazz, and how many like exactly one of the three types of music.
Answer
(a) 158 (b) 52 (c) 250
Answer for screen readers
(a) 158 freshmen (b) 52 freshmen (c) 250 freshmen
Steps to Solve
- Find the number of freshmen who like jazz but not rap
Identify the regions in the Venn diagram that represent liking jazz but not liking rap. These are the regions that are within the "jazz" circle but outside the "rap" circle. In this case, they are the regions with values 77 and 81. Add these values together. $77 + 81 = 158$
- Find the number of freshmen who like neither rock nor jazz
Identify the region in the Venn diagram that represents liking neither rock nor jazz. This is the region outside both the "rock" and "jazz" circles. In this case, it is the region showing only those who like rap, which is 52.
- Find the number of freshmen who like exactly one of the three types of music
Identify the regions in the Venn diagram which represent liking only one type of music. These are the regions that are within only one circle. These areas are 52 (only rap), 121 (only rock), and 77 (only jazz). Add these values together. $52 + 121 + 77 = 250$
(a) 158 freshmen (b) 52 freshmen (c) 250 freshmen
More Information
Venn diagrams are a useful tool for visualizing sets and their intersections.
Tips
A common mistake is misinterpreting the regions in the Venn diagram. Especially forgetting to add all the correct regions in compound questions (such as adding 77 to 81 instead of simply stating just one of them). Also double-counting regions because you misread the diagram.
AI-generated content may contain errors. Please verify critical information