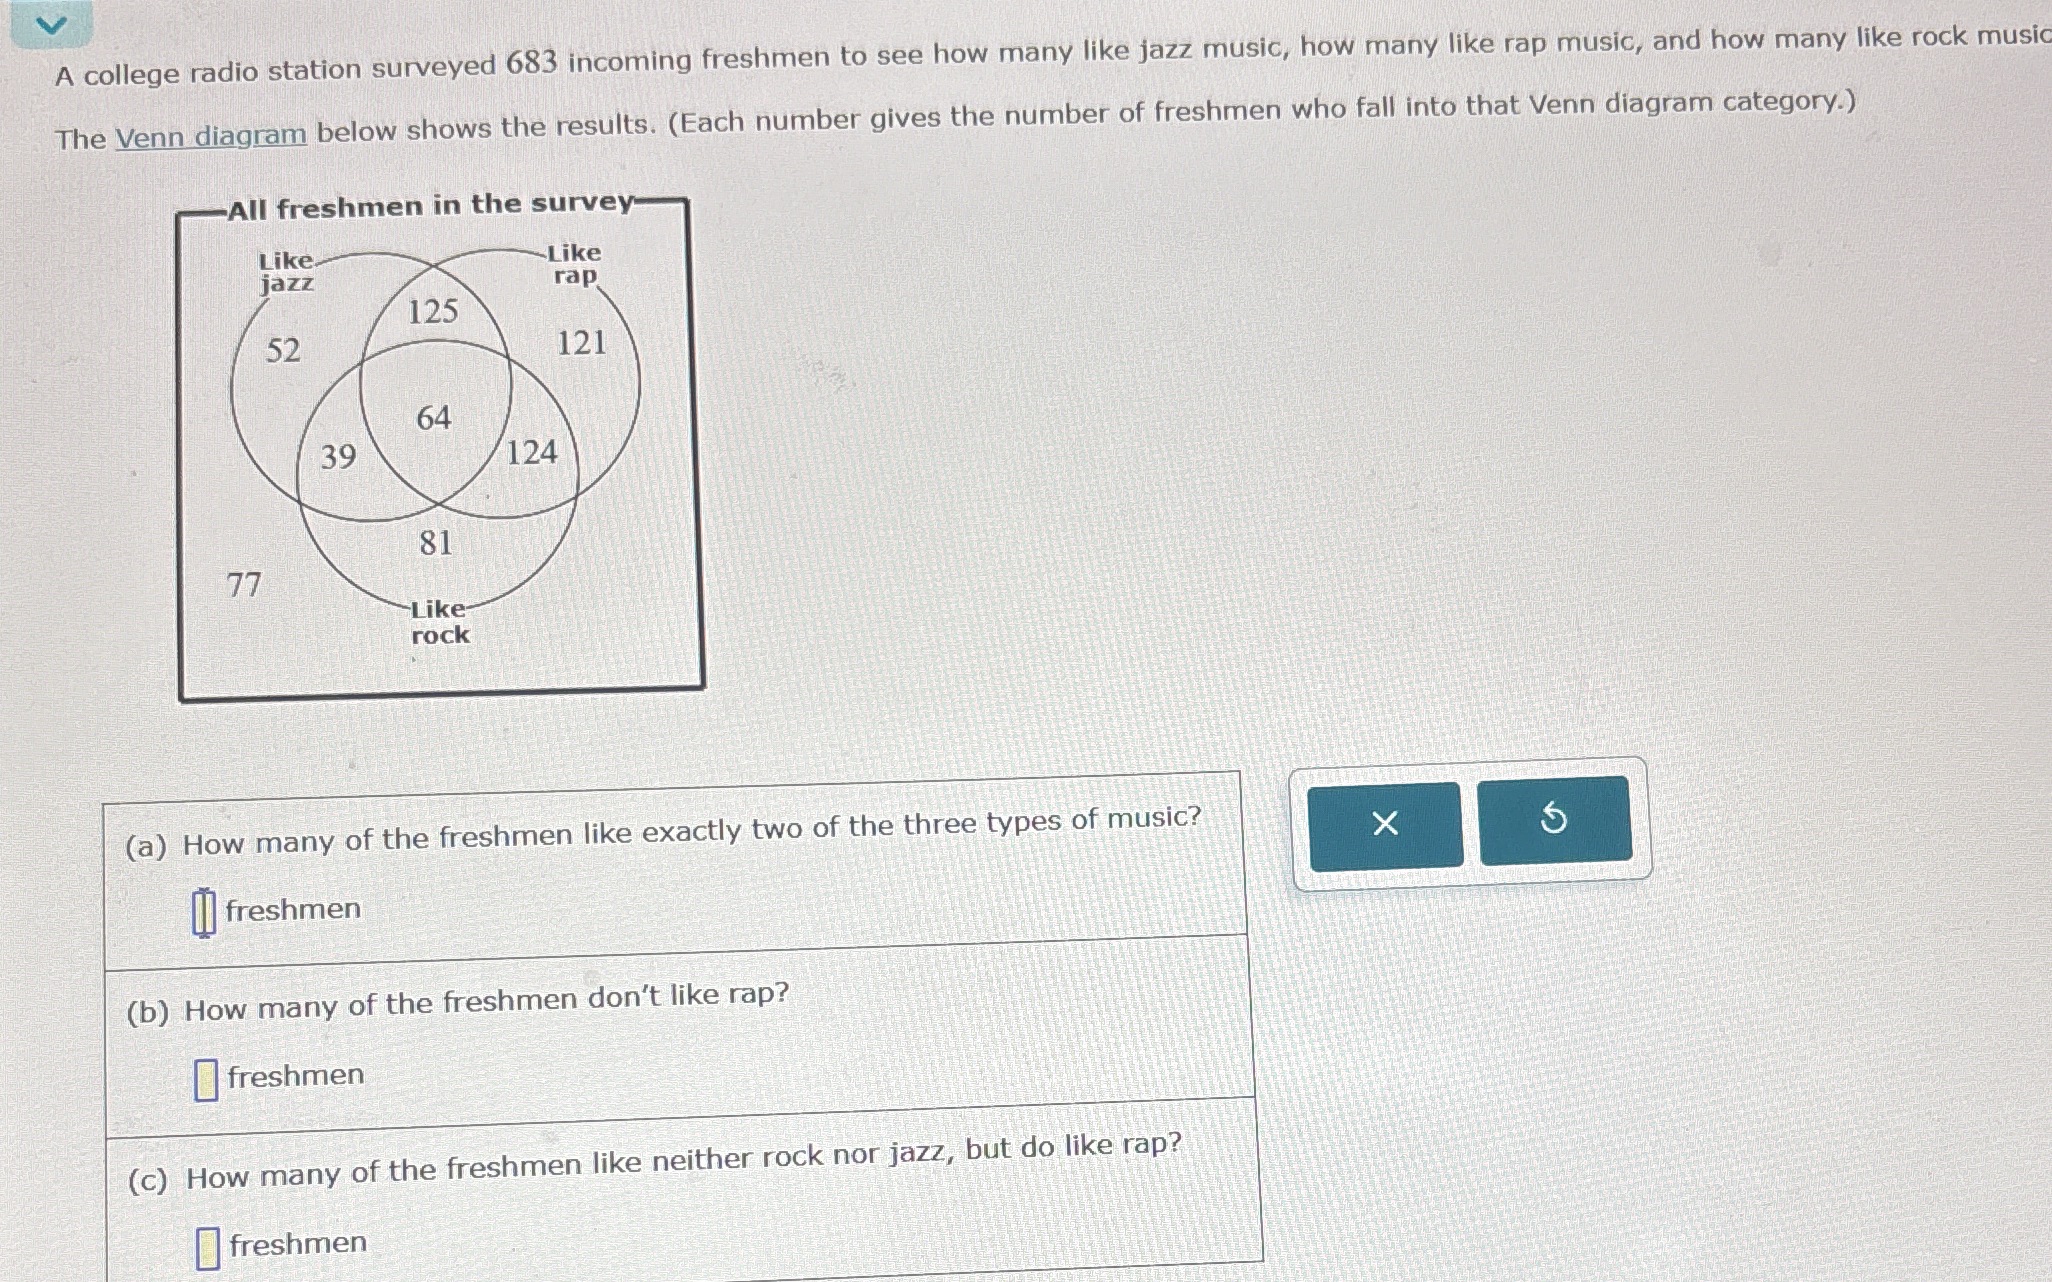
A college radio station surveyed 683 incoming freshmen to see how many like jazz music, how many like rap music, and how many like rock music. The Venn diagram below shows the resu... A college radio station surveyed 683 incoming freshmen to see how many like jazz music, how many like rap music, and how many like rock music. The Venn diagram below shows the results. (Each number gives the number of freshmen who fall into that Venn diagram category.) (a) How many of the freshmen like exactly two of the three types of music? (b) How many of the freshmen don't like rap? (c) How many of the freshmen like neither rock nor jazz, but do like rap?
Understand the Problem
The image presents a series of questions based on a Venn diagram that represents the musical preferences of 683 freshmen regarding jazz, rap, and rock music. The task is to determine the number of freshmen satisfying different criteria related to their musical tastes. The goal is to correctly interpret the Venn diagram and calculate the required values for each question.
Answer
(a) 288 (b) 249 (c) 121
Answer for screen readers
(a) 288 freshmen (b) 249 freshmen (c) 121 freshmen
Steps to Solve
- Calculate the number of freshmen who like exactly two types of music
From the Venn diagram, the numbers representing liking exactly two types of music are 39 (jazz and rock), 124 (rap and rock), and 125 (jazz and rap). Add these numbers together:
$39 + 124 + 125 = 288$
- Calculate the number of freshmen who don't like rap
To find the number of freshmen who don't like rap, we need to add the numbers in the regions of the Venn diagram that are outside the 'rap' circle. These numbers are 52, 77, and 39 and 81. We add these together: $52 + 77 + 39 + 81 = 249$
- Calculate the number of freshmen who like neither rock nor jazz, but do like rap
This corresponds to the region inside the 'rap' circle but outside both the 'rock' and 'jazz' circles. From the Venn diagram, this number is 121.
(a) 288 freshmen (b) 249 freshmen (c) 121 freshmen
More Information
Venn diagrams are a visual way to represent sets and their relationships, making it easier to solve problems involving overlapping categories.
Tips
A common mistake is misidentifying the regions in the Venn diagram or incorrectly adding the numbers, especially when dealing with overlapping sections. For example, including the number of students who like all three types of music when calculating those who like exactly two. Another common mistake is double-counting or missing sections when determining those who don't like a particular type of music. To avoid these mistakes, carefully review the Venn diagram and clearly identify the regions that correspond to the question being asked, and take your time when adding the numbers.
AI-generated content may contain errors. Please verify critical information