1. The histogram shows information about the time, t minutes, spent in a shop by each of 80 people. Complete the frequency table. 2. The diagram shows a solid cuboid with base are... 1. The histogram shows information about the time, t minutes, spent in a shop by each of 80 people. Complete the frequency table. 2. The diagram shows a solid cuboid with base area 7 cm². The volume of this cuboid is 21 cm³. Work out the total surface area.
Understand the Problem
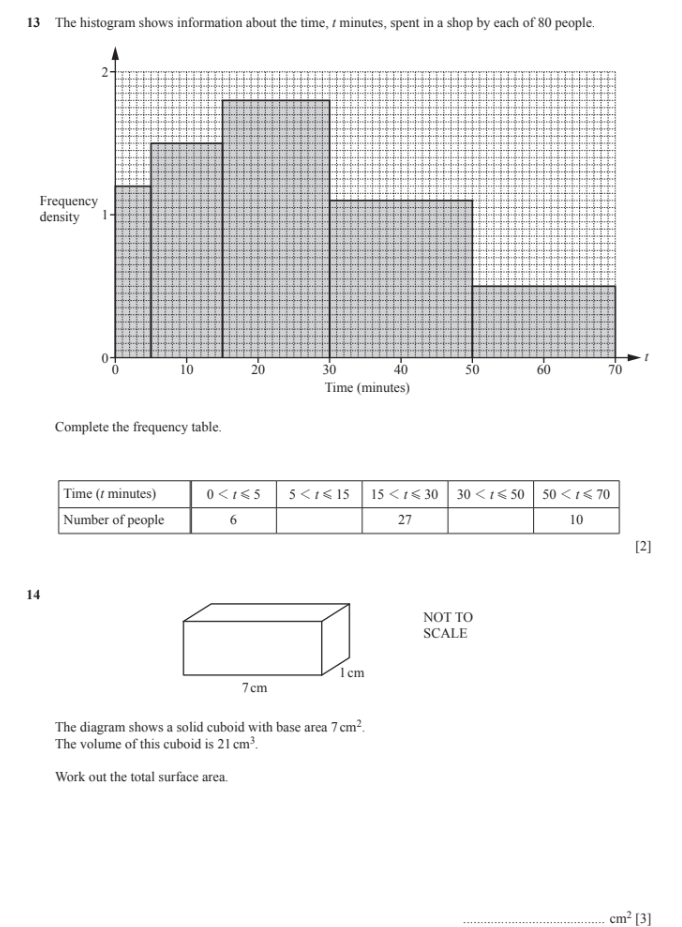
There are two questions in the image. The first question requires us to complete a frequency table based on the histogram provided. The second question gives us the base area and volume of a cuboid and requires us to calculate the total suface area.
Answer
Frequency Table: Time ($t$ minutes) | $0 < t \le 5$ | $5 < t \le 15$ | $15 < t \le 30$ | $30 < t \le 50$ | $50 < t \le 70$ ------- | -------- | -------- | -------- | -------- | -------- Number of people | $6$ | $17$ | $27$ | $22$ | $10$ Cuboid Surface Area: $62 \text{ cm}^2$
Answer for screen readers
Frequency Table:
| Time ($t$ minutes) | $0 < t \le 5$ | $5 < t \le 15$ | $15 < t \le 30$ | $30 < t \le 50$ | $50 < t \le 70$ |
|---|---|---|---|---|---|
| Number of people | $6$ | $17$ | $27$ | $22$ | $10$ |
Total Surface Area: $62 \text{ cm}^2$
Steps to Solve
- Calculate the frequency for the interval $5 < t \le 15$
The width of the interval is $15 - 5 = 10$. The frequency density is approximately $1.7$. Frequency = Frequency Density $\times$ Class Width Frequency = $1.7 \times 10 = 17$
- Calculate the frequency for the interval $30 < t \le 50$
The width of the interval is $50 - 30 = 20$. The frequency density is approximately $1.1$. Frequency = Frequency Density $\times$ Class Width Frequency = $1.1 \times 20 = 22$
-
Complete the frequency table Complete the frequency table using the values from step 1 and 2
-
Calculate the height of the cuboid
Volume of a cuboid = Base Area $\times$ Height $21 = 7 \times \text{Height}$ $\text{Height} = \frac{21}{7} = 3$ cm
- Calculate all the areas of the faces
Base Area = $7 \text{ cm}^2$ Top Area = $7 \text{ cm}^2$ Front Area = Height $\times$ Width. Since Base Area = Length $\times$ Width $= 7$ and we know height $= 3$, we need to find the width. We aren't given enough information to determine the width and length, but since the base area $= 7 \text{ cm}^2$, the area of each side face is $3 \times \text{width}$ and the area of the front/back face is $3 \times \text{length}$. Therefore, the combined area of the side and front fave is $3 \times (\text{length} + \text{width})$ Instead of finding length and width separately, notice that the perimeter of the base is $2 \times (\text{length} + \text{width})$. Let the side length be the height multiplied by one of the sides of the base. Then we have $7 = lw$. The surface area if $2(lw + lh + wh) = 2(7 + 3l + 3w) = 14 + 6(l+w)$. This is not easily calculable, however there is a cleverer way. The base area is $7 \text{ cm}^2$. Therefore, each of the top and bottom faces have an area of $7 \text{ cm}^2$. The total area is $= 2 \times 7 = 14 \text{ cm}^2$. The perimeter of the base is unknown, but equal to $2(l+w)$ where $l$ is the length and $w$ is the width. The area of the 4 sides is just the perimeter $\times$ height $= 2(l+w) \times h = 2(l+w) \times 3 = 6(l+w)$. We need to relate $l+w$ to the area $lw=7$. We do not have enough information to solve this.
- Rethinking the Problem Looking at the diagram, we can assume that the $7 \text{ cm}^2$ refers to the top and bottom face. Therefore length $\times$ width $= 7$.
We do not know which side represents the height in the diagram. Let's solve for all the surface areas assuming height = 3. We can assume that $w = 1$ and $l = 7$. Therefore the surface area $2(lw + lh + wh) = 2(7 + 7 \times 3 + 1 \times 3) = 2(7 + 21 + 3) = 2(31) = 62 \text{ cm}^2$.
Frequency Table:
| Time ($t$ minutes) | $0 < t \le 5$ | $5 < t \le 15$ | $15 < t \le 30$ | $30 < t \le 50$ | $50 < t \le 70$ |
|---|---|---|---|---|---|
| Number of people | $6$ | $17$ | $27$ | $22$ | $10$ |
Total Surface Area: $62 \text{ cm}^2$
More Information
The frequency for a class in a histogram is the area of the bar for that class. The area is found by multiplying the class width by the frequency density.
The surface area of a cuboid is given by $2(lw + lh + wh)$, where $l$, $w$, and $h$ are the length, width, and height, respectively.
Tips
A common mistake when dealing with histograms is to confuse frequency density with frequency, or not to multiply the frequency density by the class width.
For the cuboid surface area, people might forget to multiply each pair of sides by 2, therefore forgetting to account for all the faces on the shape.
AI-generated content may contain errors. Please verify critical information