Podcast
Questions and Answers
How does an increase in the spread of measurements around the mean affect the standard deviation (SD) of a distribution?
How does an increase in the spread of measurements around the mean affect the standard deviation (SD) of a distribution?
- It does not affect the standard deviation.
- It increases the standard deviation. (correct)
- It decreases the standard deviation.
- It makes the standard deviation equal to zero.
Given a normal distribution, approximately what percentage of the data falls within one standard deviation of the mean?
Given a normal distribution, approximately what percentage of the data falls within one standard deviation of the mean?
- 34%
- 68% (correct)
- 50%
- 95%
What does a smaller standard deviation indicate about a dataset?
What does a smaller standard deviation indicate about a dataset?
- The data points are clustered closer to the mean. (correct)
- The mean is larger than in other datasets.
- The dataset contains more outliers.
- The data points are more spread out from the mean.
In the standard deviation formula, what does the term 'N' represent?
In the standard deviation formula, what does the term 'N' represent?
What is the primary reason for calculating the area under a normal distribution curve?
What is the primary reason for calculating the area under a normal distribution curve?
What does the 'bell curve' in the context of measurements primarily represent?
What does the 'bell curve' in the context of measurements primarily represent?
In a normal distribution curve, which of the following statements is most accurate regarding the mean?
In a normal distribution curve, which of the following statements is most accurate regarding the mean?
If a distribution curve is described as 'normal,' what characteristic is most likely true about the errors it represents?
If a distribution curve is described as 'normal,' what characteristic is most likely true about the errors it represents?
What does the breadth (width) of a normal distribution curve indicate about a set of measurements?
What does the breadth (width) of a normal distribution curve indicate about a set of measurements?
Why is the normal distribution significant in statistics, particularly concerning measurement errors?
Why is the normal distribution significant in statistics, particularly concerning measurement errors?
In a normal distribution, what does the area under the curve between two specific values represent?
In a normal distribution, what does the area under the curve between two specific values represent?
Assuming a normal distribution, if you measure a value that is more than 2 standard deviations (SD) above the mean, what is the approximate probability of observing such a value by chance?
Assuming a normal distribution, if you measure a value that is more than 2 standard deviations (SD) above the mean, what is the approximate probability of observing such a value by chance?
In the context of measurements and normal distributions, what does a small standard deviation (SD) indicate?
In the context of measurements and normal distributions, what does a small standard deviation (SD) indicate?
In a scenario where data are normally distributed, approximately what is the probability of measuring a value between the mean and one standard deviation above the mean?
In a scenario where data are normally distributed, approximately what is the probability of measuring a value between the mean and one standard deviation above the mean?
A researcher observes a distribution of data with distinct categories: 'Far left', 'Left', 'Center', 'Right', and 'Far right'. The frequencies are 6%, 25%, 39%, 25%, and 6% respectively. What is the probability of measuring a value that is either 'Left' or 'Right'?
A researcher observes a distribution of data with distinct categories: 'Far left', 'Left', 'Center', 'Right', and 'Far right'. The frequencies are 6%, 25%, 39%, 25%, and 6% respectively. What is the probability of measuring a value that is either 'Left' or 'Right'?
As the number of levels of studs increases in the ball-dropping experiment, what happens to the distribution of ball positions around the center?
As the number of levels of studs increases in the ball-dropping experiment, what happens to the distribution of ball positions around the center?
In the context of the ball-dropping experiment, what does the term 'noise' refer to?
In the context of the ball-dropping experiment, what does the term 'noise' refer to?
With two levels of studs, why is the 'center' position twice as likely to be hit compared to the 'left' or 'right' positions?
With two levels of studs, why is the 'center' position twice as likely to be hit compared to the 'left' or 'right' positions?
Initially, when dropping balls without any studs, the distribution is 50% to the right and 50% to the left. What fundamental principle does this observation reflect?
Initially, when dropping balls without any studs, the distribution is 50% to the right and 50% to the left. What fundamental principle does this observation reflect?
Considering an experimental setup with many levels of studs, if 39% of the balls land in the exact center position, what can be inferred about the positions furthest from the center?
Considering an experimental setup with many levels of studs, if 39% of the balls land in the exact center position, what can be inferred about the positions furthest from the center?
The interquartile range (IQR) is useful because it:
The interquartile range (IQR) is useful because it:
How do quartiles relate to standard deviation (SD) in terms of describing data?
How do quartiles relate to standard deviation (SD) in terms of describing data?
In a box plot, what do the 'whiskers' typically represent?
In a box plot, what do the 'whiskers' typically represent?
When is it most appropriate to use quartiles and the interquartile range (IQR) instead of the mean and standard deviation (SD) to describe a dataset?
When is it most appropriate to use quartiles and the interquartile range (IQR) instead of the mean and standard deviation (SD) to describe a dataset?
What do widely spaced quartiles indicate about a dataset?
What do widely spaced quartiles indicate about a dataset?
In a dataset: 2, 5, 8, 11, 15, 18, 21, 25, what is upper quartile?
In a dataset: 2, 5, 8, 11, 15, 18, 21, 25, what is upper quartile?
Which of the following is the primary benefit of using box plots for data representation?
Which of the following is the primary benefit of using box plots for data representation?
What is the most common use of the R language mentioned?
What is the most common use of the R language mentioned?
Given a mean of 175 cm and a standard deviation of 7 cm, what is the z-score for a height of 190 cm?
Given a mean of 175 cm and a standard deviation of 7 cm, what is the z-score for a height of 190 cm?
If the z-score for a height of 200 cm is 3.571, and the z-score for infinity is used, what probability should be subtracted from the probability associated with infinity to determine the proportion of people taller than 200 cm?
If the z-score for a height of 200 cm is 3.571, and the z-score for infinity is used, what probability should be subtracted from the probability associated with infinity to determine the proportion of people taller than 200 cm?
What value of P is associated with an open upper limit for z infinity?
What value of P is associated with an open upper limit for z infinity?
In a normal distribution with a mean of 175 cm and a standard deviation of 7 cm, if the z-score for a certain height is negative, what adjustment is required when using a P-table to determine the corresponding probability?
In a normal distribution with a mean of 175 cm and a standard deviation of 7 cm, if the z-score for a certain height is negative, what adjustment is required when using a P-table to determine the corresponding probability?
Given a mean height of 175 cm and a standard deviation of 7 cm, what is the most accurate way to determine the percentage of people between 190 cm and 195 cm tall?
Given a mean height of 175 cm and a standard deviation of 7 cm, what is the most accurate way to determine the percentage of people between 190 cm and 195 cm tall?
Why is it more appropriate to calculate the probability of someone being between 1.90 and 1.95 meters tall rather than exactly 1.95 meters tall in a continuous distribution?
Why is it more appropriate to calculate the probability of someone being between 1.90 and 1.95 meters tall rather than exactly 1.95 meters tall in a continuous distribution?
Suppose in a normally distributed population with mean 175 cm and standard deviation 7 cm, you want to find the approximate percentage of individuals taller than 2 meters. Which of the following steps is correct?
Suppose in a normally distributed population with mean 175 cm and standard deviation 7 cm, you want to find the approximate percentage of individuals taller than 2 meters. Which of the following steps is correct?
Given a normal distribution of heights with a mean of 175 cm and a standard deviation of 7 cm, and the z-score for a person being taller than 2 meters is 3.571 with a corresponding probability of 0.4998, approximately what percentage of people are taller than 2 meters?
Given a normal distribution of heights with a mean of 175 cm and a standard deviation of 7 cm, and the z-score for a person being taller than 2 meters is 3.571 with a corresponding probability of 0.4998, approximately what percentage of people are taller than 2 meters?
Which characteristic of the normal distribution makes it suitable for modeling errors in measurements?
Which characteristic of the normal distribution makes it suitable for modeling errors in measurements?
Descriptive statistics allow us to make predictions about a population based on a sample.
Descriptive statistics allow us to make predictions about a population based on a sample.
What does standard deviation measure in a dataset?
What does standard deviation measure in a dataset?
In a normal distribution, the curve is highest in the middle, representing the ______ value.
In a normal distribution, the curve is highest in the middle, representing the ______ value.
Match the statistical concept with its primary purpose:
Match the statistical concept with its primary purpose:
In inferential statistics, what is the purpose of comparing the data from a sample group to the data from an established norm?
In inferential statistics, what is the purpose of comparing the data from a sample group to the data from an established norm?
A researcher is analyzing the heights of students in a school. Which descriptive statistic would best represent the 'typical' height of a student?
A researcher is analyzing the heights of students in a school. Which descriptive statistic would best represent the 'typical' height of a student?
If a dataset has a large standard deviation, the data points are closely clustered around the mean.
If a dataset has a large standard deviation, the data points are closely clustered around the mean.
Which type of statistics is primarily used to describe the characteristics of a sample group?
Which type of statistics is primarily used to describe the characteristics of a sample group?
Inferential statistics are used to determine the exact values within a population without any margin of error.
Inferential statistics are used to determine the exact values within a population without any margin of error.
In the context of statistical testing, what does a 'significant difference' suggest about a new method's effectiveness on a larger population?
In the context of statistical testing, what does a 'significant difference' suggest about a new method's effectiveness on a larger population?
The _________ distribution, often seen in errors and natural measurements, is characterized by a bell-shaped curve.
The _________ distribution, often seen in errors and natural measurements, is characterized by a bell-shaped curve.
When comparing two groups to see if a new study guide improves scores, what statistical test might be used to determine if the differences are significant and not just random variations?
When comparing two groups to see if a new study guide improves scores, what statistical test might be used to determine if the differences are significant and not just random variations?
In data analysis, which measure indicates how spread out the test scores are around the average?
In data analysis, which measure indicates how spread out the test scores are around the average?
Match the statistical concept with its primary function:
Match the statistical concept with its primary function:
Flashcards
Drop Ball Probability
Drop Ball Probability
When many balls are dropped, 50% fall right and 50% left.
Stud Impact on Distribution
Stud Impact on Distribution
Adding studs changes how balls land, increasing center hits.
True Fall Position
True Fall Position
The position where a ball would land without influence from studs.
Frequency Distribution Shape
Frequency Distribution Shape
Signup and view all the flashcards
Noise in Results
Noise in Results
Signup and view all the flashcards
Standard Deviation (SD)
Standard Deviation (SD)
Signup and view all the flashcards
Normal Distribution
Normal Distribution
Signup and view all the flashcards
Area under the Curve
Area under the Curve
Signup and view all the flashcards
Mean in Statistics
Mean in Statistics
Signup and view all the flashcards
Measurement Scattering
Measurement Scattering
Signup and view all the flashcards
Bell Curve
Bell Curve
Signup and view all the flashcards
Mean Value
Mean Value
Signup and view all the flashcards
Measurement Error
Measurement Error
Signup and view all the flashcards
Distribution
Distribution
Signup and view all the flashcards
Probability Between Mean and Mean + 1 SD
Probability Between Mean and Mean + 1 SD
Signup and view all the flashcards
Probability Over 2 SD
Probability Over 2 SD
Signup and view all the flashcards
Quartiles
Quartiles
Signup and view all the flashcards
Median
Median
Signup and view all the flashcards
Interquartile Range (IQR)
Interquartile Range (IQR)
Signup and view all the flashcards
Box Plot
Box Plot
Signup and view all the flashcards
Non-Normal Distribution
Non-Normal Distribution
Signup and view all the flashcards
Scattering of Data
Scattering of Data
Signup and view all the flashcards
Lower Quartile (Q1)
Lower Quartile (Q1)
Signup and view all the flashcards
Upper Quartile (Q3)
Upper Quartile (Q3)
Signup and view all the flashcards
Z-value
Z-value
Signup and view all the flashcards
Finding Z for 1.90 m
Finding Z for 1.90 m
Signup and view all the flashcards
P-table
P-table
Signup and view all the flashcards
Probability of height range
Probability of height range
Signup and view all the flashcards
Height above 2 m
Height above 2 m
Signup and view all the flashcards
Descriptive Statistics
Descriptive Statistics
Signup and view all the flashcards
Mode
Mode
Signup and view all the flashcards
Standard Deviation
Standard Deviation
Signup and view all the flashcards
Inferential Statistics
Inferential Statistics
Signup and view all the flashcards
Sample
Sample
Signup and view all the flashcards
T-test
T-test
Signup and view all the flashcards
Confidence Level
Confidence Level
Signup and view all the flashcards
Histogram
Histogram
Signup and view all the flashcards
Significance Testing
Significance Testing
Signup and view all the flashcards
Study Notes
Obesity Levels in Children
- Obesity levels in Year 6 children in England have risen since 2006/07
- Trends show an upward trend but no drastic fluctuations
Scatter Plot Correlation Examples
- Scatter plots show either:
- Positive correlations (as one variable increases, the other increases)
- Negative correlations (as one variable increases, the other decreases)
- No correlation
Introduction to London's History
- London, in the past, was significantly different
- London was overcrowded, dirty, and dangerous
- Well-off people didn't live in London due to conditions
Infectious Diseases in 19th Century London
- Sanitation was poor; infectious diseases like cholera were prevalent
- Cholera is a significant disease resulting in severe diarrhea and dehydration, which can be fatal
- Cholera spreads through contaminated water supplies
Cholera Outbreak of 1854
- In 1854, a severe cholera outbreak severely impacted London
- The outbreak resulted in more than 600 deaths
- Vibrio cholerae was the causative agent
John Snow and the Investigation
- John Snow investigated the cholera outbreak
- He used evidence and logic to identify the probable cause of the outbreak
- He mapped cases around London and linked cholera to a specific water pump
Pump of Death
- John Snow associated the contaminated Broad Street pump with fatal cholera cases
- Removing the pump's handle halted associated cases
The Power of Statistics
- Statistics are powerful tools in science to separate signal from noise
- Statistics help to clarify signals and provide insights into probabilities and errors
The Shape of Error
- Measurement variability arises from numerous elementary random influences.
Plinko and the Shape of Data
- Plinko illustrates how many random events result in a normal distribution
- Random bounces on studs lead to a specific landing zone, which can be statistically predicted
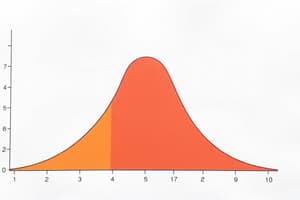
The Normal Distribution
- A normal distribution is a symmetrical, bell-shaped curve depicting the probability distribution of errors in measurements.
- The curve represents the likelihood that a measurement falls within specific ranges.
The Normal Distribution: Mean
- The mean is the center point of the normal distribution, signifying the most probable measurement upon repeated trials.
The Normal Distribution: Standard Deviation
- Standard deviation (SD) measures the distribution's width; a narrower distribution represents greater precision
- A smaller SD indicates a higher degree of precision in the measurements
The Empirical Rule and the Normal Distribution
- The empirical rule dictates the area under the normal distribution for specified SDs from the mean (68%, 95%, 99.7%)
The Standard Normal Distribution
- The standard normal distribution is a specialized normal distribution with a mean of 0 and a standard deviation of 1
- This allows probabilities to be generalized from any normal distribution
Standard Normal Distribution: Z Values
- Z-values represent the number of standard deviations a given measurement is from the mean
- Z-tables are used to calculate probabilities associated with different Z-values
Why is the Area Under the Curve Important?
- The area under the curve signifies the probability of a particular measurement falling within a given range.
- Ranges of data values can be evaluated using Z-values.
Non-Normal Distributions
- Not all distributions are normal; some skewed distributions or those with limited samples will appear non-normal
- Non-normal distributions arise when assumptions about random elementary errors are not valid
Generic Distributions
- Median divides the distribution in half; half of the values fall below and half fall above the median
- Determining the middle value(s) in an organized ascending data set provides the median
Skewed Distributions
- Skewed distributions are asymmetrical, leaning towards one side of the peak (mode)
- Positively skewed distributions have a longer tail extending towards higher values.
- Negatively skewed distributions have a longer tail extending toward lower values.
Percentiles and Quartiles
- Percentiles delineate specific percentages of values below; for instance, the 25th percentile marks the point where 25% of the values are below.
- Quartiles (Q1, Q2, Q3) are specific percentiles – Q1 is the 25th percentile; Q3 is the 75th percentile
Interquartile Range (IQR)
- Interquartile range (IQR) measures the variability or dispersion of the data; it represents the difference between the upper and lower quartiles
Box Plots
- Box plots visually display a set of data, showing quartiles, median, and outliers
R Workshops
- R workshops offer practical application of statistical concepts. Using R for representation improves data analysis skills and CV
Inferential Statistics
- Inferential statistics explores the significance of data based on probability and noise factors
Studying That Suits You
Use AI to generate personalized quizzes and flashcards to suit your learning preferences.