Podcast
Questions and Answers
What is the primary purpose of trendlines in finance?
What is the primary purpose of trendlines in finance?
- To create complex chart patterns
- To identify patterns in price charts (correct)
- To make informed trading decisions
- To predict future price movements
Which type of trendline connects two or more low points on a price chart?
Which type of trendline connects two or more low points on a price chart?
- Support Line
- Resistance Line
- Upward Trendline (correct)
- Downward Trendline
What is the name of the trendline that suggests the asset's price is trending upward over time?
What is the name of the trendline that suggests the asset's price is trending upward over time?
- Resistance Line
- Upward Trendline (correct)
- Downward Trendline
- Support Line
Why are trendlines considered subjective?
Why are trendlines considered subjective?
What should traders use in conjunction with trendlines to make well-rounded trading decisions?
What should traders use in conjunction with trendlines to make well-rounded trading decisions?
What type of trendline connects two or more high points on a price chart?
What type of trendline connects two or more high points on a price chart?
What is the purpose of an upward trendline for traders?
What is the purpose of an upward trendline for traders?
What is the name of the trendline that suggests the asset's price is trending downward over time?
What is the name of the trendline that suggests the asset's price is trending downward over time?
What is the purpose of a downward trendline for traders?
What is the purpose of a downward trendline for traders?
Flashcards are hidden until you start studying
Study Notes
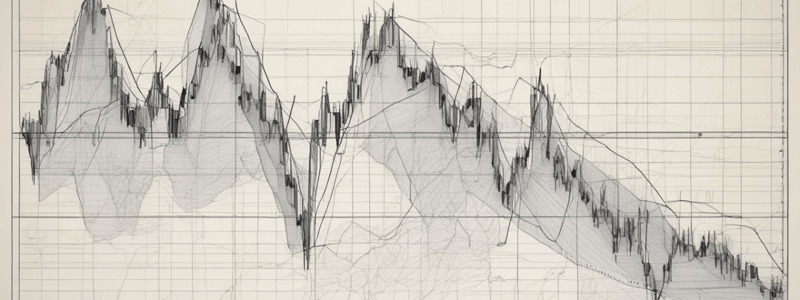
Trendlines in Finance
- Graphical representations used to analyze the direction and strength of price movements in financial markets over time.
- Created by connecting two or more significant price points on a chart, usually using a straight line.
- Help traders and analysts identify patterns, predict future price movements, and make informed trading decisions.
Types of Trendlines
-
Upward Trendline (Support Line)
- Connects two or more low points on a price chart.
- Indicates that the asset's price is trending upward over time.
- Traders often see upward trendlines as a signal to buy or enter long positions, expecting the price to continue rising.
-
Downward Trendline (Resistance Line)
- Connects two or more high points on a price chart.
- Suggests that the asset's price is trending downward over time.
- Traders often see downward trendlines as a signal to sell or enter short positions, expecting the price to continue declining.
Using Trendlines
- Traders also use secondary trendlines to identify shorter-term trends within larger trends.
- To make well-rounded trading decisions, traders should use trendlines in conjunction with other technical analysis tools and fundamental analysis.
- Trendlines are not infallible indicators and can be subjective, as different traders may draw them differently based on their interpretation of the chart's price action.
- Despite this, trendlines remain a popular tool due to their simplicity and effectiveness in identifying trends.
Studying That Suits You
Use AI to generate personalized quizzes and flashcards to suit your learning preferences.