Podcast
Questions and Answers
What does a frequency table primarily organize?
What does a frequency table primarily organize?
- Data by temporal events
- Only qualitative data
- Counts and category names (correct)
- Only numerical data
What is the key feature of a relative frequency table?
What is the key feature of a relative frequency table?
- Displays only decimal values
- Shows proportions, not percentages (correct)
- Includes negative frequency values
- Does not display totals
What does the area principle imply regarding bar charts?
What does the area principle imply regarding bar charts?
- The area corresponds to the value's magnitude (correct)
- Bars should overlap for clarity
- All bars must be of equal width
- The total area must equal 100%
What does a conditional distribution provide?
What does a conditional distribution provide?
In a contingency table, what does it highlight?
In a contingency table, what does it highlight?
Which of the following describes the Simpson's Paradox?
Which of the following describes the Simpson's Paradox?
What unique characteristic does a stem-and-leaf display have?
What unique characteristic does a stem-and-leaf display have?
What is a notable limitation of pie charts when representing data?
What is a notable limitation of pie charts when representing data?
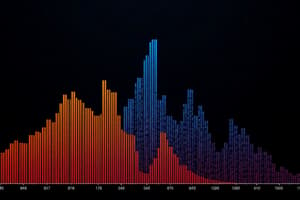
What term is used to describe the peaks in a histogram?
What term is used to describe the peaks in a histogram?
What is the definition of a sample space?
What is the definition of a sample space?
A histogram can be described as which of the following?
A histogram can be described as which of the following?
What does it imply if a histogram shows no peaks?
What does it imply if a histogram shows no peaks?
What does the probability of an event refer to?
What does the probability of an event refer to?
Which of the following statements about a symmetric distribution is correct?
Which of the following statements about a symmetric distribution is correct?
What does independence in probability signify?
What does independence in probability signify?
Outliers in a dataset can be described as which of the following?
Outliers in a dataset can be described as which of the following?
What is empirical probability based on?
What is empirical probability based on?
The addition rule in probability is applicable to which kind of events?
The addition rule in probability is applicable to which kind of events?
In a scatterplot, the strength of the relationship between variables is indicated by what?
In a scatterplot, the strength of the relationship between variables is indicated by what?
Correlation specifically measures which aspect of two variables?
Correlation specifically measures which aspect of two variables?
What distinguishes joint probabilities from conditional probabilities?
What distinguishes joint probabilities from conditional probabilities?
What is true about random variables?
What is true about random variables?
What effect do changes in the scale of either variable have on correlation?
What effect do changes in the scale of either variable have on correlation?
What does the general multiplication rule require?
What does the general multiplication rule require?
Why is Var(X ± c) = Var(X) true?
Why is Var(X ± c) = Var(X) true?
Which of the following is true regarding Var(aX)?
Which of the following is true regarding Var(aX)?
The formula Var(X + Y) = Var(X) + Var(Y) applies under which condition?
The formula Var(X + Y) = Var(X) + Var(Y) applies under which condition?
Which statement is NOT a characteristic of a Bernoulli Trial?
Which statement is NOT a characteristic of a Bernoulli Trial?
What is true about the Normal Distribution?
What is true about the Normal Distribution?
Which characteristics apply to the Standard Normal Distribution?
Which characteristics apply to the Standard Normal Distribution?
The term true proportions refers to what?
The term true proportions refers to what?
What does the 10% condition state regarding sample size?
What does the 10% condition state regarding sample size?
What is the nature of the hypothesis when $p < 0.5$?
What is the nature of the hypothesis when $p < 0.5$?
Where does the researcher's interest lie in hypothesis testing?
Where does the researcher's interest lie in hypothesis testing?
What does the P-value represent?
What does the P-value represent?
What does a low P-value indicate?
What does a low P-value indicate?
What happens if the P-value is greater than alpha ($\alpha$)?
What happens if the P-value is greater than alpha ($\alpha$)?
What is the relationship of the degrees of freedom in the context of Student's t distribution?
What is the relationship of the degrees of freedom in the context of Student's t distribution?
What does the Student's t distribution depend on?
What does the Student's t distribution depend on?
For small sample sizes (n < 15), when should the Student's t distribution not be used?
For small sample sizes (n < 15), when should the Student's t distribution not be used?
What must the sample size numbers for successes and failures satisfy according to the success/failure condition?
What must the sample size numbers for successes and failures satisfy according to the success/failure condition?
Which assertion is true regarding the Central Limit Theorem?
Which assertion is true regarding the Central Limit Theorem?
What does the standard error of $,p̂$ represent?
What does the standard error of $,p̂$ represent?
How is the standard error of $,p̂$ different from the standard deviation of $,p̂$?
How is the standard error of $,p̂$ different from the standard deviation of $,p̂$?
Can we ensure that $,p̂$ is within $,p̂ \pm 2 \times SE(p̂)$?
Can we ensure that $,p̂$ is within $,p̂ \pm 2 \times SE(p̂)$?
What does the margin of error (ME) calculate in statistical analysis?
What does the margin of error (ME) calculate in statistical analysis?
How can we be assured that $,p$ is within the confidence interval?
How can we be assured that $,p$ is within the confidence interval?
What is the critical value $z^*$ for a 95% confidence interval?
What is the critical value $z^*$ for a 95% confidence interval?
Flashcards
Frequency Table
Frequency Table
A table that organizes categorical data by recording counts for each category.
Relative Frequency Table
Relative Frequency Table
A table that shows the proportions (or percentages) of each category.
Area Principle
Area Principle
The area of a bar on a graph should correspond to the value it represents.
Pie Chart
Pie Chart
Signup and view all the flashcards
Marginal Distribution
Marginal Distribution
Signup and view all the flashcards
Contingency Table
Contingency Table
Signup and view all the flashcards
Simpson's Paradox
Simpson's Paradox
Signup and view all the flashcards
Stem-and-Leaf Display
Stem-and-Leaf Display
Signup and view all the flashcards
Sample Space
Sample Space
Signup and view all the flashcards
Probability of an Event
Probability of an Event
Signup and view all the flashcards
Independence (Events)
Independence (Events)
Signup and view all the flashcards
Empirical Probability
Empirical Probability
Signup and view all the flashcards
Probability of All Possible Outcomes
Probability of All Possible Outcomes
Signup and view all the flashcards
Multiplication Rule (Probability)
Multiplication Rule (Probability)
Signup and view all the flashcards
Addition Rule (Probability)
Addition Rule (Probability)
Signup and view all the flashcards
Disjoint Events
Disjoint Events
Signup and view all the flashcards
Histogram peaks
Histogram peaks
Signup and view all the flashcards
Uniformly distributed data
Uniformly distributed data
Signup and view all the flashcards
Symmetric distribution
Symmetric distribution
Signup and view all the flashcards
Scatterplot
Scatterplot
Signup and view all the flashcards
Scatterplot relationship strength
Scatterplot relationship strength
Signup and view all the flashcards
Explanatory/Predictor Variable
Explanatory/Predictor Variable
Signup and view all the flashcards
Correlation
Correlation
Signup and view all the flashcards
Correlation and outliers
Correlation and outliers
Signup and view all the flashcards
Var(X ± c) = Var(X)
Var(X ± c) = Var(X)
Signup and view all the flashcards
Var(aX)
Var(aX)
Signup and view all the flashcards
Var(X ± Y)
Var(X ± Y)
Signup and view all the flashcards
Bernoulli Trial Characteristics
Bernoulli Trial Characteristics
Signup and view all the flashcards
Normal Distribution
Normal Distribution
Signup and view all the flashcards
Standard Normal Distribution
Standard Normal Distribution
Signup and view all the flashcards
True Proportions in Sampling
True Proportions in Sampling
Signup and view all the flashcards
Sampling Distribution of Proportions
Sampling Distribution of Proportions
Signup and view all the flashcards
One-sided alternative
One-sided alternative
Signup and view all the flashcards
Two-sided alternative
Two-sided alternative
Signup and view all the flashcards
What is tested in the alternative hypothesis?
What is tested in the alternative hypothesis?
Signup and view all the flashcards
P-value
P-value
Signup and view all the flashcards
Low p-value meaning
Low p-value meaning
Signup and view all the flashcards
Failing to reject the null hypothesis
Failing to reject the null hypothesis
Signup and view all the flashcards
Standard error
Standard error
Signup and view all the flashcards
Student's t-distribution properties
Student's t-distribution properties
Signup and view all the flashcards
Success/Failure Condition
Success/Failure Condition
Signup and view all the flashcards
Central Limit Theorem
Central Limit Theorem
Signup and view all the flashcards
Standard Error of p̂
Standard Error of p̂
Signup and view all the flashcards
SD(p̂) vs SE(p̂)
SD(p̂) vs SE(p̂)
Signup and view all the flashcards
Confidence Interval (p̂)
Confidence Interval (p̂)
Signup and view all the flashcards
Margin of Error
Margin of Error
Signup and view all the flashcards
Hypothesis Testing - p
Hypothesis Testing - p
Signup and view all the flashcards
Alternative Hypothesis (H1)
Alternative Hypothesis (H1)
Signup and view all the flashcards
Study Notes
Frequency Tables
- Frequency tables organize data by recording counts and category names.
- They do not organize only quantitative data.
- They organize data.
Relative Frequency Tables
- Relative frequency tables display proportions, not percentages.
- They display proportions, not percentages.
- They can display '0%'
Area Principle
- The area of a bar should correspond to the magnitude of its value in data displays.
- The area of a bar cannot be zero.
Frequencies of Categorical Variables
- Combining frequencies of two categorical variables does not always result in 100%.
- Combining frequencies of two categorical variables may or may not result in 100%.
Pie Charts
- Pie charts are more useful than bar charts when comparing categories.
- Pie charts lack overlapping categories.
- Pie charts do not always add up to 100%.
Marginal Distribution
- The marginal distribution is the same as the frequency distribution in a contingency table.
- The marginal distribution is for variables with negligible probabilities.
Contingency Table Totals
- Contingency table totals can be expressed in percents.
Conditional Distribution
- A conditional distribution gives the distribution of one variable for cases that satisfy a specific condition.
- It involves one variable given a condition on another.
- It applies only to categorical variables, not just correlated ones.
Simpson's Paradox
- Simpson's Paradox occurs when combining percentages from different groups.
- Inappropriately combining percentages of different groups leads to this issue.
Stem-and-Leaf Displays
- In stem-and-leaf displays, the first digit of the number represents a bin.
- The next digit of the number is for the bar.
- Stem-and-leaf displays are similar in shape to histograms.
Describing Distributions
- Distribution descriptions include shape, center, and spread.
Histograms
- Peaks in a histogram are called modes.
- A histogram can have no peaks, be unimodal, or be multimodal.
- A histogram without a peak implies data is uniformly distributed
Symmetric Distributions
- Distributions are symmetric when their halves mirroring the center.
Outliers
- Outliers can be errors in data.
- Outliers can be extraordinary events affecting statistical methods.
- Outliers affect statistical analyses.
Scatterplots
- Scatterplots display one quantitative variable against another.
Direction in Scatterplots
Scatterplots are analyzed for direction and form.
- Clusters and their tightness show the strength of relationships.
Bivariate Analysis
- Scatterplots are a form of bivariate analysis.
- Bivariate analysis involves two variables, multivariate analysis involves multiple variables.
- Univariate analysis involves one variable.
Explanatory Variables
- Explanatory variables are also known as predictor variables or independent variables.
Correlation
- Correlation measures the strength of a linear relationship among variables.
- Correlation measures linear association and not always the strength of the relationship.
Correlation and Variables
- Correlation is not affected by the scaling of either variable.
- Correlation sign shows the direction of the association.
- Outliers can affect correlation results significantly.
Lurking Variables
- Lurking variables simultaneously affect two variables.
- Lurking variables are often unobserved, like business cycles.
Sample Space
- The sample space is the collection of all possible outcomes in a statistical experiment.
- This includes all potential results of an action.
Probability of an Event
- The probability of an event is its long-run frequency.
- The probability is based on possible outcomes.
Independence
- Independent events do not influence each other.
- Independent events have equal probability of occurring.
Empirical Probability
- Empirical probability estimates probabilities based on observations.
- It uses repeated observations to estimate the value.
Probability of Possible Outcomes
- The probability of all possible outcomes sums to 1 (or 100%).
- A set including all possible outcomes is complete.
Multiplication Rule
- The multiplication rule applies only to independent events.
Addition Rule
- The addition rule applies only to disjoint events.
Disjoint Events
- Disjoint events cannot be independent, although they can be, but not necessarily.
Conditional Probability
- Conditional probability depends on marginal probabilities.
P Value
- The p-value is the probability of observing data given a specific hypothesis.
Rejection of Hypothesis
- P-values above a significance level mean failing to reject the null hypothesis.
Standard Error
- The standard error estimates the standard deviation of a sample statistic.
Student's t-distribution
- The t-distribution changes with sample size.
- The t-distribution is similar to the normal distribution in larger samples.
- Degrees of freedom affect how t-distribution is used
Degrees of Freedom in a t-test
- Degrees of freedom in t-tests depend on sample size and confidence level.
Sample Size Considerations
- Student's t-model may not hold for very small samples or skewed distributions.
- Larger samples make t-distributions more similar to normal distributions.
Studying That Suits You
Use AI to generate personalized quizzes and flashcards to suit your learning preferences.