Podcast
Questions and Answers
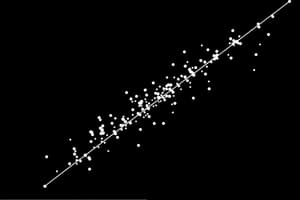
What does a coefficient of correlation (r) of 0.75 indicate?
What does a coefficient of correlation (r) of 0.75 indicate?
- A weak negative linear relationship
- An inverse relationship with high variability
- No relationship between the variables
- A strong positive linear relationship (correct)
Which of the following best describes a negative correlation?
Which of the following best describes a negative correlation?
- Both variables increase together
- Both variables decrease together
- Both variables maintain a constant value
- One variable increases while the other decreases (correct)
What is the range of values that a coefficient of correlation (r) can take?
What is the range of values that a coefficient of correlation (r) can take?
- -1.0 to 1.0 (correct)
- 0 to 1.0 only
- 1.00 to 10.0
- 0.00 to 100
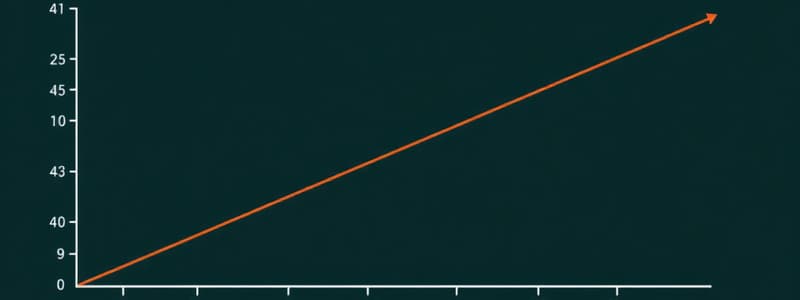
What signifies a positive correlation in variables?
What signifies a positive correlation in variables?
In correlation analysis, which variable is considered the independent variable?
In correlation analysis, which variable is considered the independent variable?
What happens to the p value as the sample size increases?
What happens to the p value as the sample size increases?
Why is it important to examine effect sizes in research?
Why is it important to examine effect sizes in research?
Which of the following statements best reflects a constructive hypothesis formulation?
Which of the following statements best reflects a constructive hypothesis formulation?
What is a misconception about p values in research studies?
What is a misconception about p values in research studies?
Which statement about the relationship between p values and sample sizes is true?
Which statement about the relationship between p values and sample sizes is true?
What is Thomas Bayes best known for?
What is Thomas Bayes best known for?
What does Bayesian statistics primarily utilize in its analysis?
What does Bayesian statistics primarily utilize in its analysis?
Who edited and published Thomas Bayes' notes after his death?
Who edited and published Thomas Bayes' notes after his death?
What is a key responsibility of someone using Bayesian statistics?
What is a key responsibility of someone using Bayesian statistics?
Why might non-practitioners struggle with understanding clinical significance?
Why might non-practitioners struggle with understanding clinical significance?
What percentage of reliability is accepted for a 1-RM Leg Press according to the content?
What percentage of reliability is accepted for a 1-RM Leg Press according to the content?
What common fear affects people's approach to Bayesian statistics?
What common fear affects people's approach to Bayesian statistics?
What is the accepted reliability limit for VO2 Max?
What is the accepted reliability limit for VO2 Max?
What does a correlation value (r) of less than 0.00 signify?
What does a correlation value (r) of less than 0.00 signify?
What does R² (Coefficient of Determination) represent in a regression analysis?
What does R² (Coefficient of Determination) represent in a regression analysis?
What does a standard error (SE) indicate in predictive modeling?
What does a standard error (SE) indicate in predictive modeling?
What is generally accepted about a p value of 0.06 in research?
What is generally accepted about a p value of 0.06 in research?
Why might researchers consider the p < 0.05 threshold arbitrary?
Why might researchers consider the p < 0.05 threshold arbitrary?
Which of the following best describes the relationship portion of a p value in significance testing?
Which of the following best describes the relationship portion of a p value in significance testing?
What does a correlation value near 1.0 indicate?
What does a correlation value near 1.0 indicate?
What is implied when it is stated, 'I DON’T CARE!' regarding applied statistics for kinesiology?
What is implied when it is stated, 'I DON’T CARE!' regarding applied statistics for kinesiology?
What does a 90% confidence interval (CI) signify?
What does a 90% confidence interval (CI) signify?
What is indicated by an error bar that ranges from -6.0% to 8.0%?
What is indicated by an error bar that ranges from -6.0% to 8.0%?
How does a 99% confidence interval differ from a 90% confidence interval?
How does a 99% confidence interval differ from a 90% confidence interval?
What is meant by the term 'true value of the sample mean' in this context?
What is meant by the term 'true value of the sample mean' in this context?
Which confidence level would provide the widest error bar range?
Which confidence level would provide the widest error bar range?
What could a decrease in confidence level from 99% to 90% imply?
What could a decrease in confidence level from 99% to 90% imply?
In the context of confidence intervals, what does a range of -2.0% to -10.0% indicate?
In the context of confidence intervals, what does a range of -2.0% to -10.0% indicate?
What is a potential misconception about confidence intervals?
What is a potential misconception about confidence intervals?
Why might someone use a confidence interval in research?
Why might someone use a confidence interval in research?
What does the null hypothesis (H0) state in a statistical test?
What does the null hypothesis (H0) state in a statistical test?
What does an alpha level of 0.05 imply in hypothesis testing?
What does an alpha level of 0.05 imply in hypothesis testing?
How does increasing the alpha level to 0.01 affect the reliability of results?
How does increasing the alpha level to 0.01 affect the reliability of results?
What is a research hypothesis based on?
What is a research hypothesis based on?
In the example provided, what was the expected outcome regarding the wearable devices?
In the example provided, what was the expected outcome regarding the wearable devices?
What does probability (p) indicate in the context of hypothesis testing?
What does probability (p) indicate in the context of hypothesis testing?
Which statement is true regarding the level of chance occurrence?
Which statement is true regarding the level of chance occurrence?
What is the significance of having a statistically significant finding?
What is the significance of having a statistically significant finding?
Flashcards
Research Hypothesis
Research Hypothesis
A prediction about the outcome of a study, based on logic and prior research.
Null Hypothesis
Null Hypothesis
A statement that there is NO difference or relationship between variables in a study.
Alpha (α)
Alpha (α)
The probability of making a Type I error, set by the researcher before the study.
Probability (p)
Probability (p)
Signup and view all the flashcards
Type I Error
Type I Error
Signup and view all the flashcards
Level of Significance
Level of Significance
Signup and view all the flashcards
Gold Standard
Gold Standard
Signup and view all the flashcards
Wearable Device
Wearable Device
Signup and view all the flashcards
Confidence Interval (CI)
Confidence Interval (CI)
Signup and view all the flashcards
Confidence Level
Confidence Level
Signup and view all the flashcards
Error Bar
Error Bar
Signup and view all the flashcards
90% Confidence Interval
90% Confidence Interval
Signup and view all the flashcards
95% Confidence Interval
95% Confidence Interval
Signup and view all the flashcards
99% Confidence Interval
99% Confidence Interval
Signup and view all the flashcards
Sample Mean
Sample Mean
Signup and view all the flashcards
True Value of the Mean
True Value of the Mean
Signup and view all the flashcards
Delta PV%
Delta PV%
Signup and view all the flashcards
Day
Day
Signup and view all the flashcards
Correlation
Correlation
Signup and view all the flashcards
Coefficient of Correlation (r)
Coefficient of Correlation (r)
Signup and view all the flashcards
Positive Correlation
Positive Correlation
Signup and view all the flashcards
Negative Correlation
Negative Correlation
Signup and view all the flashcards
Dependent Variable
Dependent Variable
Signup and view all the flashcards
Bayes' Theorem
Bayes' Theorem
Signup and view all the flashcards
Bayesian Statistics
Bayesian Statistics
Signup and view all the flashcards
Clinical Significance
Clinical Significance
Signup and view all the flashcards
Reliability of Test
Reliability of Test
Signup and view all the flashcards
Athletic Assessment
Athletic Assessment
Signup and view all the flashcards
One-Rep Maximum (1-RM)
One-Rep Maximum (1-RM)
Signup and view all the flashcards
VO2 Max
VO2 Max
Signup and view all the flashcards
Range of Motion (ROM)
Range of Motion (ROM)
Signup and view all the flashcards
Correlation Coefficient (r)
Correlation Coefficient (r)
Signup and view all the flashcards
Strong Negative Correlation (r < 0.00)
Strong Negative Correlation (r < 0.00)
Signup and view all the flashcards
Coefficient of Determination (R²)
Coefficient of Determination (R²)
Signup and view all the flashcards
Standard Error (SE)
Standard Error (SE)
Signup and view all the flashcards
p-value
p-value
Signup and view all the flashcards
Statistical Significance
Statistical Significance
Signup and view all the flashcards
Magnitude of Effect
Magnitude of Effect
Signup and view all the flashcards
Arbitrary p-value
Arbitrary p-value
Signup and view all the flashcards
P-value Dependence on Sample Size
P-value Dependence on Sample Size
Signup and view all the flashcards
Significance vs. Magnitude
Significance vs. Magnitude
Signup and view all the flashcards
Effect Size Matters
Effect Size Matters
Signup and view all the flashcards
Hypothesis Focus: Magnitude Over Significance
Hypothesis Focus: Magnitude Over Significance
Signup and view all the flashcards
Quantifying Performance Benefit
Quantifying Performance Benefit
Signup and view all the flashcards
Study Notes
Statistical Concepts in Kinesiology Research
- This presentation covers chapters 6-9 of kinesiology research.
- The presentation's title is "The Numbers Will Love You Back in Return-I Promise" by Martin Buchheit.
- Key learning objectives include the importance of statistics in kinesiology, statistical definitions, differences between groups, relationships between variables, and applied statistics.
- Statistics is a method of interpreting data objectively.
- Descriptive statistics describe data characteristics.
- Inferential statistics analyze relationships or differences in datasets.
- Statistics involves inferring from samples to populations.
Importance of Statistics in Kinesiology
- Statistical tools determine if observed differences are chance occurrences or true differences in larger populations.
- Data analysis helps businesses optimize performance, increase efficiency, maximize profits, and make better decisions.
- Data analytics is analyzing raw data to draw conclusions.
Prevalence of Obesity
- Graphs displayed US maps showing prevalence of overall obesity (BMI ≥30) and severe obesity (BMI ≥35) in 2010 and 2020, 2030 showing projected increases.
Statistical Definitions
-
Mean (µ): The average score of a group of scores.
-
Standard deviation (σ): An estimate of the variability of scores around the mean.
-
Confidence intervals (CI): Displays the probability that the true score falls between lower and upper values.
-
90% CI: Represents 90% confidence.
-
95% CI: Represents 95% confidence.
-
99% CI: Represents 99% confidence.
-
Central tendency: A score representing all scores (mean, median, mode).
-
Median: The mid-point score in a dataset.
-
Mode: The most frequent score.
-
Normal Distribution: When the mean, median, and mode are the same, and 68%, 95%, and 99% of scores lie within one, two, and three standard deviations from the mean, respectively.
-
Skewness: Describes the direction of the hump of a data distribution curve and the nature of its tails (skewed left or right).
-
Kurtosis: Measures the vertical characteristic of the data distribution—whether the curve is more peaked (leptokurtic) or flatter (platykurtic) than a normal curve.
-
Parametric statistical test: A test based on data assumptions of normal distribution, equal variance, and independence of observations.
-
Nonparametric statistical test: Statistical techniques used when data doesn't meet assumptions for parametric tests.
Statistical Issues in Research Planning and Evaluation (Chapter 7)
- Hypothesis Testing:
- Research hypothesis: Deduced from theory, based on logic, predicting study outcome.
- Null hypothesis (H0): Assumes no difference (or relationship) between treatments/variables.
- Alpha: A probability level (significance level) set by the experimenter before the study. A common value is 0.05 (i.e., the probability of a false-positive result is 5%).
- Probability (p): The likelihood of an event occurring. Significance levels should be understood in context.
Importance of Applied Statistics for Kinesiology
- p-values: Highly dependent on sample size. Larger sample size tends to produce lower p-values.
- Effect size: The magnitude of change is more important than p-value significance.
- Effect significance: The meaningful practical implications of found effects or relationships. Quantitative assessment of effects is better than simple significance tests.
- Defining research questions: Clarifying the measurement of effect size can lead to better research questions.
Applied Research
- Choices on p-values are often arbitrary, magnitude or importance of actual effects are key factors.
Applied Statistics for Kinesiology
- Bayes' theorem: Using prior research knowledge to inform statistical analysis, decision about clinical significance.
- Reliability of tests: Includes 1-RM leg press (kg), VO2 max (mL kg-1 min-1), ROM (degrees of knee joint), different tests have different degrees of reliability so these should be considered when designing a study.
Bayesian Statistics
-
You are the expert in clinical significance, and understand the risks/stress and responsibility of data interpretation
-
Typical hypotheses need clearer foundations and may be quantitatively defined.
### Additional Points
- This presentation contained various graphs and images illustrative of the concepts discussed.
- Many examples were cited to show the application of various statistical approaches.
Studying That Suits You
Use AI to generate personalized quizzes and flashcards to suit your learning preferences.
Related Documents
Description
Test your knowledge on correlation analysis and Bayesian statistics with this quiz. Explore concepts such as the coefficient of correlation, effect sizes, and the importance of independent variables in statistical research. Challenge yourself with questions related to misconceptions in p values and contributions by Thomas Bayes.