Podcast
Questions and Answers
What is primarily displayed by contour maps?
What is primarily displayed by contour maps?
- Population density
- Variation of altitude (correct)
- Climate zones
- Vegetation types
A shaded relief map uses color gradients to represent elevation changes.
A shaded relief map uses color gradients to represent elevation changes.
False (B)
What does the term 'aspect' refer to in the context of terrain models?
What does the term 'aspect' refer to in the context of terrain models?
Compass direction of maximum rate of change of altitude
The _____ network is crucial for delineating areas for flooding analysis.
The _____ network is crucial for delineating areas for flooding analysis.
Match the terrain features with their descriptions:
Match the terrain features with their descriptions:
Which of the following components is NOT a part of the slope model in a Digital Elevation Model (DEM)?
Which of the following components is NOT a part of the slope model in a Digital Elevation Model (DEM)?
A drainage basin is characterized by areas that direct water flow to a specific point.
A drainage basin is characterized by areas that direct water flow to a specific point.
What is the primary use of analytical stereoplotters in creating altitude matrices?
What is the primary use of analytical stereoplotters in creating altitude matrices?
What is a major disadvantage of thick and short hachures on steep slopes?
What is a major disadvantage of thick and short hachures on steep slopes?
Vertical exaggeration can accurately represent actual elevations on maps.
Vertical exaggeration can accurately represent actual elevations on maps.
What method creates vector-based representations of the physical land surface?
What method creates vector-based representations of the physical land surface?
A Digital Elevation Model (DEM) is a digital representation of ground surface ________.
A Digital Elevation Model (DEM) is a digital representation of ground surface ________.
Match the following terms with their descriptions:
Match the following terms with their descriptions:
What is a common use of Digital Elevation Models?
What is a common use of Digital Elevation Models?
Lower scale maps demonstrate less vertical exaggeration.
Lower scale maps demonstrate less vertical exaggeration.
What does a larger ratio of vertical scale to horizontal scale indicate on a map?
What does a larger ratio of vertical scale to horizontal scale indicate on a map?
Gridding methods can help in creating accurate ________ maps.
Gridding methods can help in creating accurate ________ maps.
Which of the following is NOT a use of DEM?
Which of the following is NOT a use of DEM?
What is a disadvantage of using spot heights for elevation indication?
What is a disadvantage of using spot heights for elevation indication?
Shading is used to show the general features of land where relief is low and slopes are gentle.
Shading is used to show the general features of land where relief is low and slopes are gentle.
What effect do hachures create when illustrating terrain features?
What effect do hachures create when illustrating terrain features?
In layer tints, _____ tones are used for higher elevations.
In layer tints, _____ tones are used for higher elevations.
Match the following methods with their advantages:
Match the following methods with their advantages:
Which of the following is true about layer tints?
Which of the following is true about layer tints?
Relief models provide a two-dimensional representation of terrain.
Relief models provide a two-dimensional representation of terrain.
What is the primary use of shading in elevation mapping?
What is the primary use of shading in elevation mapping?
Hachures are rows of short, nearly _____ lines used to express relief.
Hachures are rows of short, nearly _____ lines used to express relief.
What is the main disadvantage of using a relief model?
What is the main disadvantage of using a relief model?
Flashcards
Spot Heights
Spot Heights
Indicates elevations at specific points (benchmarks, hilltops, depressions, road intersections) on a map.
Relief Model
Relief Model
Represents terrain as a 3D miniature with accurate horizontal and vertical scales.
Shading
Shading
Shows general terrain features using light and shadow effects to represent high areas and steep slopes.
Hachures
Hachures
Signup and view all the flashcards
Layer Tints
Layer Tints
Signup and view all the flashcards
Digital Elevation Model (DEM)
Digital Elevation Model (DEM)
Signup and view all the flashcards
Relief Methods
Relief Methods
Signup and view all the flashcards
Contours
Contours
Signup and view all the flashcards
Layer Tints
Layer Tints
Signup and view all the flashcards
Contours
Contours
Signup and view all the flashcards
Altitude Matrix (DTM)
Altitude Matrix (DTM)
Signup and view all the flashcards
What are contour maps?
What are contour maps?
Signup and view all the flashcards
TIN (Triangulated Irregular Network) Model
TIN (Triangulated Irregular Network) Model
Signup and view all the flashcards
What is slope in a DEM?
What is slope in a DEM?
Signup and view all the flashcards
What is aspect in a DEM?
What is aspect in a DEM?
Signup and view all the flashcards
What is shaded relief?
What is shaded relief?
Signup and view all the flashcards
What is drainage network delineation?
What is drainage network delineation?
Signup and view all the flashcards
How is drainage network analysis useful?
How is drainage network analysis useful?
Signup and view all the flashcards
Contour Lines - Hachures
Contour Lines - Hachures
Signup and view all the flashcards
Vertical Exaggeration
Vertical Exaggeration
Signup and view all the flashcards
Triangulated Irregular Network (TIN)
Triangulated Irregular Network (TIN)
Signup and view all the flashcards
Gridding Methods
Gridding Methods
Signup and view all the flashcards
DEM Products: Block Diagrams, Profiles, and Horizons
DEM Products: Block Diagrams, Profiles, and Horizons
Signup and view all the flashcards
DEM Products: Aspect Maps
DEM Products: Aspect Maps
Signup and view all the flashcards
DEM Products: Slope Maps
DEM Products: Slope Maps
Signup and view all the flashcards
DEM Products: Shaded Relief Maps
DEM Products: Shaded Relief Maps
Signup and view all the flashcards
DEM Products: Line of Sight Analysis
DEM Products: Line of Sight Analysis
Signup and view all the flashcards
Study Notes
RELIEF MODELLING AND DIGITAL ELEVATION MODEL (DEM)
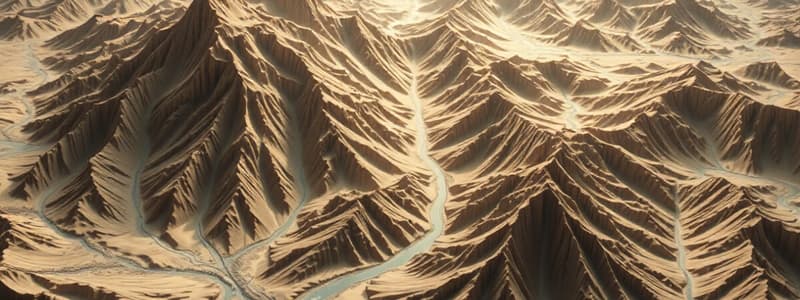
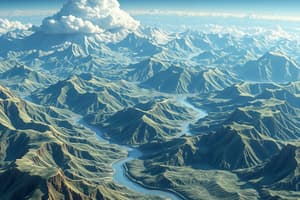
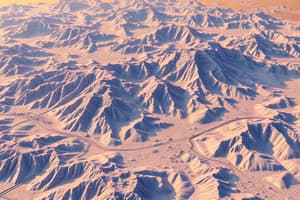
- Relief methods are used for representing the shape of land
- Spot heights: Indicate elevation at specific points (e.g., benchmarks, hilltops), accurate but don't show the overall shape
- Shading: Creates light and shadow based on an assumed light source from the northwest, good for visualizing general relief and steepness
- Hachures: Short parallel lines showing slope direction and steepness, effective for areas with varied slopes
- Layer tints: Use different colors or tones to represent elevation zones; easy for large-scale maps but may not show internal variations
- Relief model: 3D representation of terrain; suitable for visualizing details and educating various professionals
LAYER TINTS
- Use distinctive colors or tones to represent elevation
- Lighter tones for higher elevations, darker for lower
- Colors (e.g., cool greens for lower, warm oranges/browns/reds for higher)
- Disadvantage: Doesn't always show internal variations within an elevation zone
RELIEF MODEL
- 3D representation, good for visualizing terrain features
- Horizontal and vertical scales necessary for accuracy
- Useful for instructing, showcasing terrain to the public, and assisting geologists, geographers, and engineers in special studies
- Advantages: Easy to visualize, great for representing terrain
- Disadvantages: Requires storage space and transportation
DIGITAL ELEVATION MODEL (DEM)
- Digital representation of ground surface topography
- Any representation reflecting continuous elevation variations
- Can represent terrain with elevation data only
- Used in various fields: topographic mapping, engineering design, etc.
USES OF DEM
- Extracting terrain parameters
- Engineering and infrastructure design
- 3D landform visualization
- Military purposes (weapons guidance systems, pilot training)
- Landscape design and planning
- Flight simulations, modeling environmental aspects
- Creating physical models, visualizing terrain
- Reducing gravity measurements, estimating run-off/erosion
- Producing slope maps, aspect maps, shaded relief maps
ALTITUDE MATRIX
- Regular grid obtained from stereoscopic aerial photographs
- Use in calculations for contours, slopes, angles, aspects, hillshading and basin delineations, and automatic calculations
- Easy for acquiring data but data redundancy exists in uniform areas
- Can't adapt well to diverse relief complexity without changing the grid
TRIANGULATED IRREGULAR NETWORK (TIN)
- Vector-based representation of the physical land surface (or sea floor)
- Nodes with X, Y and Z coordinates, arranged in triangles.
- Point density increases as terrain variation increases, a flexible method
- Require visual inspection to control the network.
GRIDDING METHODS
- Generating contour maps & other representations through XYZ coordinates
- Allows generation of accurate maps from dispersed data, which needs interpolation
- Different interpolation methods will yield varied outcomes
DEM PRODUCTS
- Block diagrams, profiles, and horizons
- Useful for visualizing elevation changes and quantitative variables
- Contour maps
- Can be easily produced from altitude matrices based on specified height classes using different colors/tones
Studying That Suits You
Use AI to generate personalized quizzes and flashcards to suit your learning preferences.


