Podcast
Questions and Answers
What typically happens to the predator population after an increase in the prey population?
What typically happens to the predator population after an increase in the prey population?
- The predator population decreases gradually.
- The predator population remains constant.
- The predator population immediately decreases.
- The predator population increases after a time delay. (correct)
In the predator-prey cycle, what is the primary role of the 'c' variable in the Lotka-Volterra model?
In the predator-prey cycle, what is the primary role of the 'c' variable in the Lotka-Volterra model?
- It represents the growth rate of the prey population.
- It reflects the death rate of the prey population.
- It denotes the rate of change in the predator population.
- It indicates the ability of predators to capture prey. (correct)
Under what condition will the prey population increase according to the Lotka-Volterra model?
Under what condition will the prey population increase according to the Lotka-Volterra model?
- When the death rate of the predator population is low.
- When the capture efficiency of predators exceeds growth rate of prey.
- When the growth rate of prey exceeds the product of the predator and prey population. (correct)
- When the predator population is higher than the prey population.
What length of cycles is observed in large animals like hares and lynxes in Arctic tundra regions?
What length of cycles is observed in large animals like hares and lynxes in Arctic tundra regions?
Which component of the Lotka-Volterra model is primarily associated with the efficiency of transforming food into population growth for predators?
Which component of the Lotka-Volterra model is primarily associated with the efficiency of transforming food into population growth for predators?
What is the primary factor that leads to a decline in the prey population during the predator-prey cycle?
What is the primary factor that leads to a decline in the prey population during the predator-prey cycle?
In the context of predator-prey cycles, what does the term 'capture efficiency' refer to?
In the context of predator-prey cycles, what does the term 'capture efficiency' refer to?
Which of the following statements best describes the Lotka-Volterra model equation for the prey population?
Which of the following statements best describes the Lotka-Volterra model equation for the prey population?
What happens to the predator population following a decline in the prey population?
What happens to the predator population following a decline in the prey population?
Which factor primarily contributes to the growth of the predator population in the Lotka-Volterra model?
Which factor primarily contributes to the growth of the predator population in the Lotka-Volterra model?
What is the time interval between population peaks in the predator-prey cycle typically observed in large animals like hares and lynxes in the Arctic tundra?
What is the time interval between population peaks in the predator-prey cycle typically observed in large animals like hares and lynxes in the Arctic tundra?
In which situation will the prey population experience growth according to the Lotka-Volterra model?
In which situation will the prey population experience growth according to the Lotka-Volterra model?
What does the variable 'd' in the predator population equation signify?
What does the variable 'd' in the predator population equation signify?
How does the population cycle of small animals differ in frequency compared to larger animals in the Arctic tundra?
How does the population cycle of small animals differ in frequency compared to larger animals in the Arctic tundra?
Which of the following accurately describes the term 'a' in the predator population equation?
Which of the following accurately describes the term 'a' in the predator population equation?
What describes the relationship between the predator and prey populations in the predator-prey cycle?
What describes the relationship between the predator and prey populations in the predator-prey cycle?
What is the primary factor that determines whether the prey population will grow, according to the Lotka-Volterra model?
What is the primary factor that determines whether the prey population will grow, according to the Lotka-Volterra model?
Which variable in the Lotka-Volterra model represents the size of the predator population?
Which variable in the Lotka-Volterra model represents the size of the predator population?
Which cycle frequency is typically observed in small animal populations in Arctic tundra regions?
Which cycle frequency is typically observed in small animal populations in Arctic tundra regions?
What does the variable 'a' in the predator population equation represent?
What does the variable 'a' in the predator population equation represent?
What is a consequence of an increase in predator population in the predator-prey cycle?
What is a consequence of an increase in predator population in the predator-prey cycle?
When analyzing the Lotka-Volterra equations, what does the term 'c' represent?
When analyzing the Lotka-Volterra equations, what does the term 'c' represent?
In the Lotka-Volterra model, what happens to the prey population when 'rR' is less than 'cRP'?
In the Lotka-Volterra model, what happens to the prey population when 'rR' is less than 'cRP'?
Which statement accurately describes the relationship seen in predator-prey cycles over time?
Which statement accurately describes the relationship seen in predator-prey cycles over time?
What is the significance of the period of the cycle in predator-prey dynamics?
What is the significance of the period of the cycle in predator-prey dynamics?
What characterizes the Holling Type I functional response?
What characterizes the Holling Type I functional response?
Which type of functional response includes a plateau in the number of prey consumed?
Which type of functional response includes a plateau in the number of prey consumed?
What primarily triggers a Type III functional response in predators?
What primarily triggers a Type III functional response in predators?
What does the numerical response of predators depend upon when a Type II or III response is observed?
What does the numerical response of predators depend upon when a Type II or III response is observed?
Which of the following is NOT an assumption of the Lotka-Volterra predation model?
Which of the following is NOT an assumption of the Lotka-Volterra predation model?
Which statement describes the relationship between prey availability and predator consumption in a Type I functional response?
Which statement describes the relationship between prey availability and predator consumption in a Type I functional response?
What effect does switching behaviors have on predator populations?
What effect does switching behaviors have on predator populations?
What is a significant limitation of the Lotka-Volterra predation model?
What is a significant limitation of the Lotka-Volterra predation model?
In what situation would a predator most likely exhibit a Type III response?
In what situation would a predator most likely exhibit a Type III response?
Flashcards
Predator-Prey Cycles
Predator-Prey Cycles
Natural fluctuations in predator and prey populations, often showing cyclical patterns. Predators depend on prey for food, so prey population changes influence predator population changes (and vice-versa).
Lotka-Volterra Predation Model
Lotka-Volterra Predation Model
A mathematical model describing predator-prey interactions, showing how changes in prey and predator population sizes influence each other. It's a simplified representation of the dynamics.
Prey Population Equation
Prey Population Equation
dR/dt = rR – cRP. The change in prey population (dR/dt) is based on prey growth minus the prey lost to predators. r is prey growth rate, c is predator capture rate.
Predator Population Equation
Predator Population Equation
Signup and view all the flashcards
Predator-Prey Cycle Period
Predator-Prey Cycle Period
Signup and view all the flashcards
Predator-Prey Cycle
Predator-Prey Cycle
Signup and view all the flashcards
Lynx and Hare
Lynx and Hare
Signup and view all the flashcards
9-year Arctic Cycle
9-year Arctic Cycle
Signup and view all the flashcards
4-year Small Animal Cycle
4-year Small Animal Cycle
Signup and view all the flashcards
Predator Increase
Predator Increase
Signup and view all the flashcards
Prey Decrease
Prey Decrease
Signup and view all the flashcards
Lotka-Volterra Model
Lotka-Volterra Model
Signup and view all the flashcards
Prey Population Equation
Prey Population Equation
Signup and view all the flashcards
Predator Population Equation
Predator Population Equation
Signup and view all the flashcards
Population Cycle Period
Population Cycle Period
Signup and view all the flashcards
Predator-Prey Cycle
Predator-Prey Cycle
Signup and view all the flashcards
Lotka-Volterra Model
Lotka-Volterra Model
Signup and view all the flashcards
Prey Population Equation
Prey Population Equation
Signup and view all the flashcards
Predator Population Equation
Predator Population Equation
Signup and view all the flashcards
Population Cycle Period
Population Cycle Period
Signup and view all the flashcards
Predator-Prey Relationship
Predator-Prey Relationship
Signup and view all the flashcards
Lynx and Hare
Lynx and Hare
Signup and view all the flashcards
9-year Arctic Cycle
9-year Arctic Cycle
Signup and view all the flashcards
4-year Small Animal Cycle
4-year Small Animal Cycle
Signup and view all the flashcards
Predator Increase
Predator Increase
Signup and view all the flashcards
Type I Functional Response
Type I Functional Response
Signup and view all the flashcards
Type II Functional Response
Type II Functional Response
Signup and view all the flashcards
Type III Functional Response
Type III Functional Response
Signup and view all the flashcards
Numerical Response
Numerical Response
Signup and view all the flashcards
Lotka-Volterra Model
Lotka-Volterra Model
Signup and view all the flashcards
Functional Response
Functional Response
Signup and view all the flashcards
Satiation
Satiation
Signup and view all the flashcards
Heterogeneous habitat
Heterogeneous habitat
Signup and view all the flashcards
Search Image
Search Image
Signup and view all the flashcards
Switching to alternative food
Switching to alternative food
Signup and view all the flashcards
Study Notes
Predator-Prey Cycles
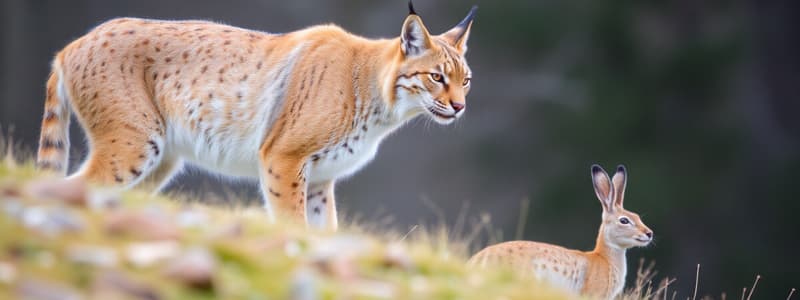
- Classic example: North American lynx (Lynx canadensis) preys almost exclusively on snowshoe hares (Lepus americanus).
- Lynx and hare populations exhibit highly synchronized cycles.
- Graph shows lynx and hare population fluctuations over time.
Predator-Prey Cycles in Arctic Tundra Regions
- Large animals (hare, muskrat, ruffed grouse) have 9-year cycles.
- Lynx and red fox are predators of these animals.
- Small animals (voles, mice, lemmings) have 4-year cycles.
- Hawks and owls are predators of these animals.
Predator-Prey Cycle Dynamics
- Prey population increase leads to more food for predators, causing predator population to increase (with a time delay).
- Increased predator population intensifies predation, decreasing prey population size.
Theoretical Model
- Prey population size follows cyclical peaks and troughs.
- Predator population size cycles, lagging behind prey numbers.
- The period of a cycle (time between peaks) is approximately 10 years.
- Shows graphical relationships between prey and predator populations.
Lotka-Volterra Predation Model
- Prey equation: dR/dt = rR – cRP.
- dR/dt: rate of change in prey population
- r: growth rate of prey
- R: size of prey population
- c: capture efficiency of predator
- P: size of predator population
- Predator equation: dP/dt = acRP – dP.
- dP/dt: rate of change in predator population
- a: assimilation efficiency
- d: death rate of predator
When Populations Increase
- For prey, populations increase when rR > cRP (growth rate > removal rate). Rearranging this results in P < r/c.
- For predator populations, increase occurs with higher prey and assimilation efficiency.
Equilibrium of Populations
- Populations are at equilibrium when the rate of change (dR/dt and dP/dt) is zero.
- dR/dt = rR - cRP = 0; P = r/c
- dP/dt = acRP - dP = 0; R = d/ac
Equilibrium Isocline
- Line of zero growth for prey and predator populations.
- Shows the relationship between prey and predator densities at equilibrium.
- Graphs illustrate the lines for zero growth for prey and predator populations.
Joint Population Trajectory
- Cyclic relationship shown as a circular trajectory on a graph with prey density on x-axis and predator density on y-axis.
- Indicate the cyclical increases and decreases in predator and prey populations.
Studying That Suits You
Use AI to generate personalized quizzes and flashcards to suit your learning preferences.