Podcast
Questions and Answers
Which animal is primarily preyed upon by the North American lynx?
Which animal is primarily preyed upon by the North American lynx?
- Muskrat
- Vole
- Ruffed grouse
- Snowshoe hare (correct)
What is indicated by the 9-year population cycles in Arctic tundra regions?
What is indicated by the 9-year population cycles in Arctic tundra regions?
- Aquatic animals such as muskrats
- Birds such as hawks and owls
- Large animals such as hare and lynx (correct)
- Small animals such as voles and mice
What happens to the prey population when the predator population increases?
What happens to the prey population when the predator population increases?
- Prey population stabilizes
- Prey population decreases (correct)
- Prey population increases rapidly
- Prey population becomes extinct
In the Lotka-Volterra model, what does 'c' represent?
In the Lotka-Volterra model, what does 'c' represent?
When will the prey population increase according to the Lotka-Volterra model?
When will the prey population increase according to the Lotka-Volterra model?
What is the main focus of the Lotka-Volterra predation model?
What is the main focus of the Lotka-Volterra predation model?
Which of the following accurately describes 'd' in the predator population equation?
Which of the following accurately describes 'd' in the predator population equation?
What effect does an increase in snowshoe hare population have on lynx population, based on predator-prey dynamics?
What effect does an increase in snowshoe hare population have on lynx population, based on predator-prey dynamics?
What is the role of 'a' in the Lotka-Volterra model?
What is the role of 'a' in the Lotka-Volterra model?
Which cycle length is typical for small animal populations like voles and mice in Arctic tundra regions?
Which cycle length is typical for small animal populations like voles and mice in Arctic tundra regions?
Flashcards
Predator-Prey Cycles
Predator-Prey Cycles
Fluctuations in the populations of predator and prey species over time, often with cyclical patterns.
Lynx and Snowshoe Hare
Lynx and Snowshoe Hare
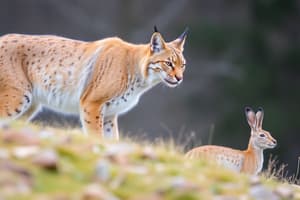
A classic example of a predator-prey relationship, where the lynx preys on the snowshoe hare.
Lotka-Volterra Model
Lotka-Volterra Model
A mathematical model that describes how predator and prey populations change over time.
Prey Population Growth
Prey Population Growth
Signup and view all the flashcards
Predator Population Growth
Predator Population Growth
Signup and view all the flashcards
Predator-Prey Model Equation(Prey)
Predator-Prey Model Equation(Prey)
Signup and view all the flashcards
Predator Population Model Equation
Predator Population Model Equation
Signup and view all the flashcards
Capture Efficiency (c)
Capture Efficiency (c)
Signup and view all the flashcards
Assimilation Efficiency (a)
Assimilation Efficiency (a)
Signup and view all the flashcards
Predator-prey cycle period
Predator-prey cycle period
Signup and view all the flashcards
Study Notes
Predator-Prey Cycles
- A classic example involves the North American lynx (Lynx canadensis) that primarily preys on the snowshoe hare (Lepus americanus).
- Lynx and hare populations exhibit a strong synchronization, with their numbers fluctuating in cyclical patterns.
- The cycles are evident in data spanning roughly from 1850 to 1925.
Predator-Prey Cycles in Arctic Tundra
- In Arctic tundra regions, large animals (hare, muskrat, ruffed grouse) have a 9-year cycle.
- Smaller animals (voles, mice, lemmings) have a 4-year cycle .
- Corresponding predators (lynx, red fox for large; hawks, owls for smaller) also exhibit cyclical population fluctuations which match the prey.
Predator-Prey Cycle Dynamics
- Prey population increases, resulting in more food for predators, and subsequently, predator populations also increase (though with a time delay).
- Increased predator populations lead to higher predation rates and a decrease in the prey population's size.
- These two phenomena lead to recurring cycles.
Theoretical Model
- This model charts the oscillatory relationship between predator and prey populations over time.
- The time between peaks in the respective population curves is denoted as the period, roughly 10 year in the model presented.
Lotka-Volterra Predation Model
-
A model for prey population change over time:
dR/dt = rR - cRP.Ris the prey population size.ris the prey's growth rate.cis the predator capture/efficiency rate.Pis the predator population size.
-
A model for predator population change over time:
dP/dt = acRP - dP.ais a measure of assimilation efficiency (how well prey is converted to predator growth).dis the constant predator death rate.
-
The models demonstrate interacting relationships between predator and prey numbers
Conditions for Population Increase
- Prey populations will increase when the prey's intrinsic growth rate (
rR) exceeds the rate of consumption (cRP). - Mathematically, this translates to
rR > cRP, which is equivalent to having a predator population less than the ratior/c.
Equilibrium Conditions
- Populations reach equilibrium when the rate of change of each population is zero.
- For prey:
dR/dt = rR - cRP = 0, soP = r/c. - For predators:
dP/dt = acRP - dP = 0, soR = d/ac.
- For prey:
Equilibrium Isoclines
- Equilibrium isoclines are lines where populations neither grow nor contract due to the balance between predator and prey dynamics.
- Prey-isocline is a horizontal line where change in prey population is null.
- Predator-isocline is a vertical line where change in predator population is null.
Joint Population Trajectory
- This model shows how the populations change over time in a cyclic pattern, graphically demonstrating the interplay between prey and predator populations.
Predator-Prey Cycle Summary
- A rise in prey population is typically followed by a rise in the predator population.
- The rise in predators causes a decline in prey populations.
- The decline in prey results in fewer predators, leading prey populations to grow again, thus completing a cyclical pattern.
Studying That Suits You
Use AI to generate personalized quizzes and flashcards to suit your learning preferences.
Related Documents
Description
Explore the dynamics of predator-prey relationships, with a focus on Arctic tundra ecosystems. This quiz dives into the cyclical patterns observed in populations of lynx and their prey, such as snowshoe hares and voles, highlighting key ecological principles. Test your understanding of these fascinating interactions and their historical data.