Podcast
Questions and Answers
Which of the following is NOT a descriptor of a normal distribution of a random variable?
Which of the following is NOT a descriptor of a normal distribution of a random variable?
- The graph is bell-shaped
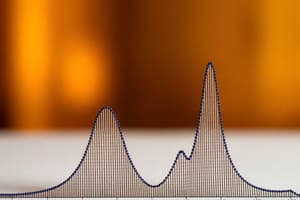
- The graph has two peaks
- The graph is symmetric
- The graph is centered around 0 (correct)
Which of the following groups of terms can be used interchangeably when working with normal distributions?
Which of the following groups of terms can be used interchangeably when working with normal distributions?
- Areas, Probability, and Relative Frequencies (correct)
- Mean, Average, and Expected Value
- Variance, Standard Deviation, and Dispersion
- Significance, Alpha, and P-value
A continuous random variable has a _______ distribution if its values are spread evenly over the range of possibilities.
A continuous random variable has a _______ distribution if its values are spread evenly over the range of possibilities.
uniform
Which of the following is NOT a requirement for a density curve?
Which of the following is NOT a requirement for a density curve?
Which of the following does NOT describe the standard normal distribution?
Which of the following does NOT describe the standard normal distribution?
Finding probabilities associated with distributions that are standard normal distributions is equivalent to _______.
Finding probabilities associated with distributions that are standard normal distributions is equivalent to _______.
The notation P(z) is denoting that the population distribution is _______.
The notation P(z) is denoting that the population distribution is _______.
Which of the following is NOT a procedure for determining whether it is reasonable to assume that sample data are from a normally distributed population?
Which of the following is NOT a procedure for determining whether it is reasonable to assume that sample data are from a normally distributed population?
A _____________ is a graph of points (x,y) where each x-value is from the original set of sample data, and each y-value is the corresponding z-score that is a quantile value expected from the standard normal distribution.
A _____________ is a graph of points (x,y) where each x-value is from the original set of sample data, and each y-value is the corresponding z-score that is a quantile value expected from the standard normal distribution.
Which of the following is NOT true in regards to using a normal quantile plot to determine whether or not a distribution is normal?
Which of the following is NOT true in regards to using a normal quantile plot to determine whether or not a distribution is normal?
If you select a simple random sample of M&M plain candies and construct a normal quantile plot of their weights, what pattern would you expect in the graphs?
If you select a simple random sample of M&M plain candies and construct a normal quantile plot of their weights, what pattern would you expect in the graphs?
Determine whether the arrival delay times of airlines flights appear to be from a population with a normal distribution.
Determine whether the arrival delay times of airlines flights appear to be from a population with a normal distribution.
A critical value, z Subscript alpha, denotes the _______.
A critical value, z Subscript alpha, denotes the _______.
Which concept below is NOT a main idea of estimating a population proportion?
Which concept below is NOT a main idea of estimating a population proportion?
Which of the following groups has terms that can be used interchangeably with the others?
Which of the following groups has terms that can be used interchangeably with the others?
A _______ is a single value used to approximate a population parameter.
A _______ is a single value used to approximate a population parameter.
Which of the following is NOT true of the confidence level of a confidence interval?
Which of the following is NOT true of the confidence level of a confidence interval?
Which of the following is NOT an observation about critical values?
Which of the following is NOT an observation about critical values?
Which of the following is NOT a requirement for constructing a confidence interval for estimating the population proportion?
Which of the following is NOT a requirement for constructing a confidence interval for estimating the population proportion?
When analyzing polls, which of the following is NOT a consideration?
When analyzing polls, which of the following is NOT a consideration?
Which of the following is NOT needed to determine the minimum sample size required to estimate a population proportion?
Which of the following is NOT needed to determine the minimum sample size required to estimate a population proportion?
What important feature of the poll was omitted in a newspaper illustration showing that 26% of professionals identified a certain interview turnoff?
What important feature of the poll was omitted in a newspaper illustration showing that 26% of professionals identified a certain interview turnoff?
The number of _______ for a collection of sample data is the number of sample values that can vary after certain restrictions have been imposed on all data values.
The number of _______ for a collection of sample data is the number of sample values that can vary after certain restrictions have been imposed on all data values.
Which of the following is NOT a property of the Student t distribution?
Which of the following is NOT a property of the Student t distribution?
The _______ is the best point estimate of the population mean.
The _______ is the best point estimate of the population mean.
Which of the following calculations is NOT derived from the confidence interval?
Which of the following calculations is NOT derived from the confidence interval?
Flashcards
Normal Distribution
Normal Distribution
A bell-shaped curve that is symmetrical and centered around its mean, with values spread out according to a specific pattern.
Density Curve
Density Curve
A curve that represents the distribution of a continuous variable, often used to visualize the probability of different values occurring.
Area Under the Normal Curve
Area Under the Normal Curve
Indicates the probability of a value falling within a certain range, calculated by finding the area under the curve to the left of that value.
Standard Normal Distribution
Standard Normal Distribution
Signup and view all the flashcards
Z-Score
Z-Score
Signup and view all the flashcards
Standardization
Standardization
Signup and view all the flashcards
Normal Quantile Plot
Normal Quantile Plot
Signup and view all the flashcards
Histogram
Histogram
Signup and view all the flashcards
Critical Value
Critical Value
Signup and view all the flashcards
Confidence Interval
Confidence Interval
Signup and view all the flashcards
Confidence Level
Confidence Level
Signup and view all the flashcards
Point Estimate
Point Estimate
Signup and view all the flashcards
Convenience Sample
Convenience Sample
Signup and view all the flashcards
Voluntary Response Sample
Voluntary Response Sample
Signup and view all the flashcards
Margin of Error
Margin of Error
Signup and view all the flashcards
Student t Distribution
Student t Distribution
Signup and view all the flashcards
Degrees of Freedom
Degrees of Freedom
Signup and view all the flashcards
Student's t Distribution
Student's t Distribution
Signup and view all the flashcards
Hypothesis Testing
Hypothesis Testing
Signup and view all the flashcards
Population Proportion
Population Proportion
Signup and view all the flashcards
Sample Proportion
Sample Proportion
Signup and view all the flashcards
Confidence Level
Confidence Level
Signup and view all the flashcards
Sample Variance
Sample Variance
Signup and view all the flashcards
Probability
Probability
Signup and view all the flashcards
Probability Calculation
Probability Calculation
Signup and view all the flashcards
Sample Size Determination
Sample Size Determination
Signup and view all the flashcards
Study Notes
Normal Distribution
- Normal distributions are symmetric, centered around the mean, which can be zero but is not a requirement.
- Common interchangeable terms in normal distributions include areas, probability, and relative frequencies.
- A uniform distribution has values spread evenly across its range.
Density Curves
- Density curves must adhere to specific requirements; being centered around zero is not one of them.
- A critical property of the standard normal distribution is that its graph is not uniform.
Probability and Standardization
- To find probabilities related to standard normal distributions, one must calculate the area of the shaded region in the graph.
- The notation P(z) indicates probabilities where z values correspond to standard normal distributions.
Normal Quantile Plots
- A normal quantile plot displays (x,y) points representing sample data against corresponding z-scores from the standard normal distribution.
- A normal quantile plot revealing a bell-shaped graph does not guarantee that the population distribution is normal.
Sample Data Analysis
- A histogram displaying non-bell-shaped data with multiple outliers indicates that the data does not follow a normal distribution.
- The critical value, zα, represents a z-score where an area of alpha exists to its right.
Confidence Intervals
- Estimating a population proportion utilizes a point estimate, which approximates a parameter with a single value.
- Confidence intervals have associated confidence levels; the concept that the true value of p will fall within the interval is important yet can be misunderstood.
- To determine minimum sample size for estimating a population proportion, the standard deviation is typically not needed.
Polling and Statistics
- Polling considerations should avoid voluntary response or convenience samples due to potential biases.
- Key features of polls include the margin of error, but the confidence level may sometimes be omitted despite its importance.
Student t Distribution and Degrees of Freedom
- The Student t distribution's standard deviation is not fixed at 1; it varies with sample size.
- Degrees of freedom represent the number of sample values that can differ based on imposed restrictions on data values.
Confidence Interval Interpretation
- A 99% confidence interval represents the degree of certainty that the population parameter lies within the specified range, reflecting statistical reliability.
Studying That Suits You
Use AI to generate personalized quizzes and flashcards to suit your learning preferences.