Podcast
Questions and Answers
What is a normal distribution?
What is a normal distribution?
- A unimodal, symmetrical, bell-shaped curve (correct)
- A distribution where scores are evenly spread
- A distribution with two modes
- None of the above
Most psychological variables are approximately normally distributed.
Most psychological variables are approximately normally distributed.
True (A)
What is the mathematical formula for normal distribution?
What is the mathematical formula for normal distribution?
You don't need to know it.
The mean, median, and mode are all located at the ______ percentile in a normal distribution.
The mean, median, and mode are all located at the ______ percentile in a normal distribution.
Which of the following is NOT a characteristic of normal distribution?
Which of the following is NOT a characteristic of normal distribution?
What is the area under a standardized normal curve?
What is the area under a standardized normal curve?
What does it mean when tails approach the x-axis but never touch it?
What does it mean when tails approach the x-axis but never touch it?
How can a z score be translated into a population percentage?
How can a z score be translated into a population percentage?
What information can be derived from a Normal Curve Table?
What information can be derived from a Normal Curve Table?
To find the percentile corresponding to a z score, you first convert the raw score to a Z score and then ______.
To find the percentile corresponding to a z score, you first convert the raw score to a Z score and then ______.
What is the process to determine Z scores from a percentile?
What is the process to determine Z scores from a percentile?
Flashcards are hidden until you start studying
Study Notes
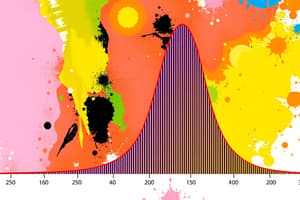
Normal Distribution Overview
- Normal distribution is a bell-shaped, symmetrical curve with most scores clustering around the mean.
- Mean, median, and mode are identical in a normal distribution, emphasizing its symmetry.
- This distribution is widely applicable and assumed for many psychological and statistical variables.
Characteristics of Normal Distribution
- Mathematically defined and theoretical; real data may approximate this but not be perfectly normal.
- Mean, median, and mode reside at the 50th percentile.
- Both tail ends of the curve approach the x-axis but never actually intersect it.
- The total area under a standardized normal curve equals 1 (or 100%).
- Standard deviation (SD) can represent any positive value, affecting the width of the curve.
Understanding Percentiles and Z Scores
- Z scores translate standard deviations from the mean and allow for calculating population percentiles.
- A normal curve table provides accurate percentages of scores between any two Z points; for instance, 34% of scores lie between the mean and a Z score of 1.
Calculating Percentiles from Z Scores
- To find the percentile corresponding to a Z score:
- Convert the raw score to a Z score, rounding to two decimal places.
- Sketch the normal curve, shading the desired area (to the left or right of the Z score, or between two Z scores).
- Use the normal curve table to identify the exact percentage, rounding down for conservative estimates.
Determining Z Scores from Percentiles
- To derive Z scores from a given percentile:
- Draw a normal curve and shade the approximate area representing the target percentile.
- Utilize the normal curve table to find the precise Z score.
- Convert Z score back to raw score when needed, allowing for practical applications in real scenarios.
Studying That Suits You
Use AI to generate personalized quizzes and flashcards to suit your learning preferences.