Podcast
Questions and Answers
What is the primary purpose of the affinity diagram process?
What is the primary purpose of the affinity diagram process?
- To evaluate the effectiveness of a brainstorming session
- To generate a new set of ideas from scratch
- To create a summary report of all collected ideas
- To organize and relate a large number of ideas systematically (correct)
Which of the following is NOT a step in the affinity diagram process?
Which of the following is NOT a step in the affinity diagram process?
- Group
- Generate
- Sort
- Analyze (correct)
In the example of Company SQBOK, what were the main categories identified from the brainstorming session?
In the example of Company SQBOK, what were the main categories identified from the brainstorming session?
- Training, Technology, Management, Costs
- Training, Feedback, Technology, Performance
- Training, Paperwork, Regulatory, Technology (correct)
- Onboarding, Compliance, Technology, Satisfaction
What method was used to display ideas during the brainstorming session for Company SQBOK?
What method was used to display ideas during the brainstorming session for Company SQBOK?
Which step in the affinity diagram process comes immediately after sorting the ideas?
Which step in the affinity diagram process comes immediately after sorting the ideas?
Who was involved in the brainstorming session at Company SQBOK?
Who was involved in the brainstorming session at Company SQBOK?
What type of output is generated from a brainstorming session in the context of affinity diagrams?
What type of output is generated from a brainstorming session in the context of affinity diagrams?
Which of these is the final step in the affinity diagram process?
Which of these is the final step in the affinity diagram process?
Flashcards
Affinity Diagram
Affinity Diagram
A visual tool that helps to organize a large number of ideas into their natural relationships.
Generate Ideas
Generate Ideas
The initial phase of an affinity diagram process where ideas are generated through brainstorming.
Display Ideas
Display Ideas
After generating ideas, they are displayed on a board, usually on sticky notes, for easy viewing and manipulation.
Sort Ideas
Sort Ideas
Signup and view all the flashcards
Group Ideas
Group Ideas
Signup and view all the flashcards
Draw the Diagram
Draw the Diagram
Signup and view all the flashcards
Onboarding
Onboarding
Signup and view all the flashcards
Onboarding Challenges
Onboarding Challenges
Signup and view all the flashcards
Study Notes
Group 6: Management & Planning Tools
- Group 6 presented on 7 management and planning tools
- Members are Camnto, Trisha and Relands, Michaela Claire
Zumba Warm-up
- All participants will join a brief Zumba warm-up session
- Randomly selected students will receive prizes after completing the routine
Quick Trivia Challenge
- A quick trivia challenge was part of the presentation
Funny Trivia 1: Office Edition
- This section presented amusing trivia questions related to office settings
Question: Missing Group Project Deadlines
- The most common excuse for missing group project deadlines is: "I thought YOU were doing it."
Funny Trivia 2: Decision-Making Woes
- This segment featured trivia focused on decision-making problems
Question: Team Decision-Making
- When a team can't agree on a solution, the most common strategy is flipping a coin.
Funny Trivia 3: Coffee Break Humor
- Trivia focused on the aspects related to humor during coffee breaks
Question: Manager's Favourite Planning Tool
- The favorite planning tool for managers is a large cup of coffee
Kaoru Ishikawa
- Developed and unified various quality management (TQM) concepts.
- Contributed to Japanese quality management.
- Evolved operations research techniques for planning and problem-solving.
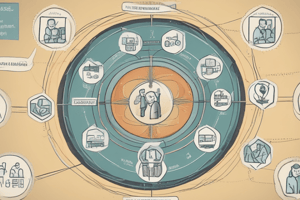
Affinity Diagram
- Created in the 1960s by Jiro Kawakita
- Organizes a large number of ideas from brainstorming sessions into their natural relationships.
- Shows the output of a brainstorming session, organized into natural relationships.
5 Steps to the Affinity Diagram Process
- Generate ideas
- Display ideas
- Sort ideas
- Group ideas
- Draw the final diagram
Example Word Problem
- Company SQBOK aimed to understand onboarding challenges and excessive time needed.
- A team of managers, employees, and HR conducted a brainstorm session.
- 15 problems were identified and written on sticky notes.
- A group categorized ideas into training, paperwork, regulatory, and technology.
- This helped to track areas and resolve deficiencies.
Interrelationship Diagram
- Shows the cause-and-effect relationships among factors in a complex situation
- A new management planning tool.
- Helps determine relationships among various factors in a situation.
Process Decision Program Chart (PDPC)
- Helps identify all potential problems in a plan, from which preventive actions are derived.
- A version of a tree diagram, with preventive actions.
PDPC-Give Sales Pitch
- A PDPC example shows potential issues (failure points) in a sales pitch, along with solutions.
Quiz Time
- Quiz portion of the presentation was held to test understanding of concepts.
Question: Brainstorming Method
- The method used to organize ideas generated during a brainstorming session is the Affinity Diagram.
Question: L-Shaped Matrix
- The L-shaped matrix that uses pairwise comparisons to choose the best options is the Prioritization Matrix.
Question: Arrow Diagram
- The key feature of an arrow diagram that is NOT a function is choosing the best option (helps determine optimal event order, evaluates project sequences, reviews interconnectivity of events).
Thank You
- Presentation concluded with gratitude.
Studying That Suits You
Use AI to generate personalized quizzes and flashcards to suit your learning preferences.