Podcast
Play an AI-generated podcast conversation about this lesson
Download our mobile app to listen on the go
Get App
Questions and Answers
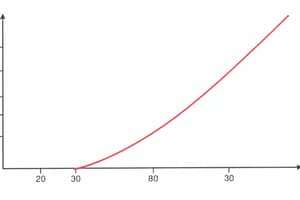
What does the Laffer Curve show?
What does the Laffer Curve show?
- The relationship between growth and inequality
- The inverse relationship between unemployment rate and inflation
- The relationship between tax rates and tax revenue collected by governments (correct)
- A graphical representation of income inequality
What does the Phillips Curve illustrate?
What does the Phillips Curve illustrate?
- The inverse relationship between unemployment rate and inflation (correct)
- A graphical representation of income inequality
- The relationship between tax rates and tax revenue collected by governments
- The relationship between growth and inequality
What is the Lorenz Curve and Gini Coefficient used to represent?
What is the Lorenz Curve and Gini Coefficient used to represent?
- The relationship between growth and inequality
- A graphical representation of income inequality (correct)
- The relationship between tax rates and tax revenue collected by governments
- The inverse relationship between unemployment rate and inflation
What is the relationship shown by the Kuznets Curve?
What is the relationship shown by the Kuznets Curve?
Signup and view all the answers
What is the dilemma posed by the Phillips Curve for policy makers?
What is the dilemma posed by the Phillips Curve for policy makers?
Signup and view all the answers
Flashcards are hidden until you start studying
Study Notes
Economic Curves
- The Laffer Curve shows the relationship between tax rates and government revenue, indicating that as tax rates increase, revenue initially increases, but then decreases as high tax rates discourage economic activity.
- The Phillips Curve illustrates the inverse relationship between unemployment and inflation rates, suggesting that as unemployment falls, inflation rises, and vice versa.
Income Inequality
- The Lorenz Curve is a graphical representation of the distribution of wealth or income, showing the proportion of the population against the proportion of total income or wealth held by that population.
- The Gini Coefficient is a measure of income inequality, ranging from 0 (perfect equality) to 1 (perfect inequality), used to quantify the degree of inequality in a society.
Economic Growth and Inequality
- The Kuznets Curve shows the relationship between economic growth and income inequality, suggesting that as an economy grows, income inequality initially increases, but then decreases as the economy reaches a certain level of development.
Policy Dilemmas
- The Phillips Curve poses a dilemma for policy makers, as they must balance the trade-off between reducing unemployment and controlling inflation, as policies aimed at reducing unemployment may lead to higher inflation, and vice versa.
Studying That Suits You
Use AI to generate personalized quizzes and flashcards to suit your learning preferences.