Podcast
Questions and Answers
What does the width of each bar in a simple bar chart represent?
What does the width of each bar in a simple bar chart represent?
- The frequency of the data
- The interval between data points (correct)
- The value of the data
- The difference between data points
What is the primary purpose of graphical data presentation?
What is the primary purpose of graphical data presentation?
- To simplify complex data for easier comprehension (correct)
- To replace tables with visual representations
- To add visual interest to numerical information
- To enhance the aesthetic appeal of data
Which of these is NOT a benefit of using graphical data representation?
Which of these is NOT a benefit of using graphical data representation?
- Highlighting outliers or unusual data points
- Demonstrating the exact values of data points (correct)
- Revealing trends in data
- Identifying patterns in data
Which principle is essential for creating effective graphical representations?
Which principle is essential for creating effective graphical representations?
What is the key element of a simple bar chart that visually represents the frequency of a data point?
What is the key element of a simple bar chart that visually represents the frequency of a data point?
Why is it important to maintain equal spacing between bars in a simple bar chart?
Why is it important to maintain equal spacing between bars in a simple bar chart?
If you want to compare the volume of cocoa exported by Nigeria across multiple years, which type of graphical representation would be most suitable?
If you want to compare the volume of cocoa exported by Nigeria across multiple years, which type of graphical representation would be most suitable?
What is the most significant advantage of using graphical representation instead of presenting data solely in a table format?
What is the most significant advantage of using graphical representation instead of presenting data solely in a table format?
What does a frequency polygon represent?
What does a frequency polygon represent?
Which of the following is true about an ogive?
Which of the following is true about an ogive?
What is the main benefit of a stem and leaf plot compared to a grouped frequency distribution?
What is the main benefit of a stem and leaf plot compared to a grouped frequency distribution?
In constructing a frequency polygon, which step should be done first?
In constructing a frequency polygon, which step should be done first?
Which of the following correctly describes how to create a stem and leaf plot?
Which of the following correctly describes how to create a stem and leaf plot?
What is the defining characteristic of the area in a histogram?
What is the defining characteristic of the area in a histogram?
When plotting an ogive, what is plotted on the x-axis?
When plotting an ogive, what is plotted on the x-axis?
What is typically the first step in creating a frequency polygon?
What is typically the first step in creating a frequency polygon?
What is the formula to find the number of degrees for each class in a pie chart?
What is the formula to find the number of degrees for each class in a pie chart?
Which step follows finding the number of degrees in constructing a pie chart?
Which step follows finding the number of degrees in constructing a pie chart?
How many degrees corresponds to blood type A if its frequency is 5?
How many degrees corresponds to blood type A if its frequency is 5?
What does a histogram use to represent the frequencies of the classes?
What does a histogram use to represent the frequencies of the classes?
What is the percentage of blood type AB if its frequency is 4?
What is the percentage of blood type AB if its frequency is 4?
In a histogram, where are the bases of the rectangles located?
In a histogram, where are the bases of the rectangles located?
If the frequency of a class in a histogram is 0, how is that class represented?
If the frequency of a class in a histogram is 0, how is that class represented?
Which frequency corresponds to the highest percentage in the given blood types data?
Which frequency corresponds to the highest percentage in the given blood types data?
What is the approximate difference in metric tons of palm kernels purchased between Okene and Oyun in 1973/1974?
What is the approximate difference in metric tons of palm kernels purchased between Okene and Oyun in 1973/1974?
Which of the following is a characteristic of a component bar chart?
Which of the following is a characteristic of a component bar chart?
In a multiple bar chart, what is the primary purpose of using multiple bars?
In a multiple bar chart, what is the primary purpose of using multiple bars?
What is the typical use of a simple bar chart?
What is the typical use of a simple bar chart?
Which of the following graphical representations would be most suitable for comparing the proportions of different spending categories for third-year college students?
Which of the following graphical representations would be most suitable for comparing the proportions of different spending categories for third-year college students?
What is the approximate average metric tons of palm kernels purchased in Okene from 1971/1972 to 1973/1974?
What is the approximate average metric tons of palm kernels purchased in Okene from 1971/1972 to 1973/1974?
Which local government area shows a consistent increase in palm kernel purchases from 1971/1972 to 1973/1974?
Which local government area shows a consistent increase in palm kernel purchases from 1971/1972 to 1973/1974?
What is the total metric tons of palm kernels purchased from both Okene and Oyun between 1971/1972 and 1973/1974?
What is the total metric tons of palm kernels purchased from both Okene and Oyun between 1971/1972 and 1973/1974?
Flashcards
Simple Bar Chart
Simple Bar Chart
A graph that represents data with rectangular bars, where the length corresponds to the value.
Multiple Bar Chart
Multiple Bar Chart
A chart that displays multiple sets of data side by side for comparison using grouped bars.
Component Bar Chart
Component Bar Chart
A bar chart divided into sections to show the breakdown of total values into parts.
Pie Chart
Pie Chart
Signup and view all the flashcards
Categorical Variables
Categorical Variables
Signup and view all the flashcards
Comparative Purposes
Comparative Purposes
Signup and view all the flashcards
Frequency in Distribution
Frequency in Distribution
Signup and view all the flashcards
Data Visualization
Data Visualization
Signup and view all the flashcards
Histogram
Histogram
Signup and view all the flashcards
Frequency Polygon
Frequency Polygon
Signup and view all the flashcards
Cumulative Frequency Chart (Ogive)
Cumulative Frequency Chart (Ogive)
Signup and view all the flashcards
Stem and Leaf Plot
Stem and Leaf Plot
Signup and view all the flashcards
Class Midpoints
Class Midpoints
Signup and view all the flashcards
Upper Boundary
Upper Boundary
Signup and view all the flashcards
Cumulative Frequency
Cumulative Frequency
Signup and view all the flashcards
Sorting Data
Sorting Data
Signup and view all the flashcards
Degree Calculation
Degree Calculation
Signup and view all the flashcards
Percentage in Pie Chart
Percentage in Pie Chart
Signup and view all the flashcards
Protractor Use
Protractor Use
Signup and view all the flashcards
Blood Group Data
Blood Group Data
Signup and view all the flashcards
Class Intervals
Class Intervals
Signup and view all the flashcards
Contiguous Bars
Contiguous Bars
Signup and view all the flashcards
Data Presentation
Data Presentation
Signup and view all the flashcards
Graphs and Charts
Graphs and Charts
Signup and view all the flashcards
Bar Chart
Bar Chart
Signup and view all the flashcards
Importance of Selection
Importance of Selection
Signup and view all the flashcards
Step-by-Step Process
Step-by-Step Process
Signup and view all the flashcards
Clarity in Communication
Clarity in Communication
Signup and view all the flashcards
Identifying Patterns
Identifying Patterns
Signup and view all the flashcards
Study Notes
Data Presentation: Charts and Graphs
-
Data presentation is crucial in statistical analysis, bridging raw data and meaningful interpretation. Effective presentation clearly communicates insights and trends.
-
Graphs and charts visually summarize data, highlighting patterns, relationships, and outliers. They transform complex data into easily understandable formats, making conclusions simpler.
-
Various graphical tools help analyze data, ranging from simple bar charts and line graphs to more complex techniques like histograms and scatter plots. These tools enable decision-making by policymakers and researchers.
Bar Charts (Graphs)
-
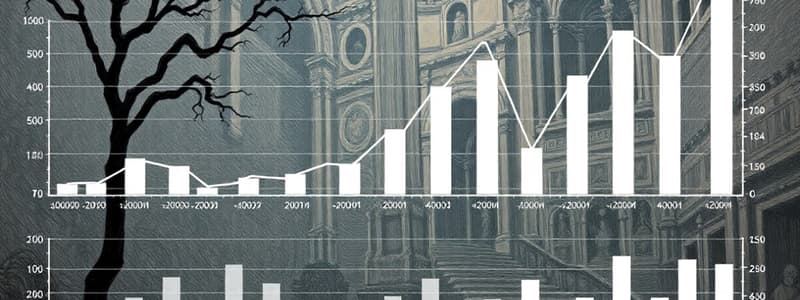
Simple bar chart: Uses vertical or horizontal bars, where bar height/length represents data frequency.
-
Each bar represents a data value and its height is equal to the value.
- All bars have the same width.
- Bars are separated by equal gaps/intervals.
-
Multiple bar chart: Useful for comparisons between categories or groups. Multiple bars for each category are used.
-
Component bar chart: A simple bar chart divided into sections, each section's height representing different variable values within each category.
Pie Charts
- Pie charts: Suitable for categorical data, presenting data as a circle divided into sections. Sections' sizes represent each category's proportion of the total.
- Each section (representing a category) is proportional to its percentage of the whole.
- Calculate percentages for each category.
- Calculate each category's degrees using the formula
Degree = (f/n) * 360°, wherefis the frequency of the category andnis the total frequency. - Use a protractor to construct sections based on calculated degrees.
Histograms
- Histograms: Visualize data distribution.
- Consists of contiguous rectangular bars.
- Class intervals/intervals are used for the horizontal axis (X-axis), indicating the data ranges.
- The bar heights correspond to the frequencies within each interval.
- The areas of the bars are proportional to the class frequencies.
Frequency Polygons
- Frequency polygons: Display data distribution using plotted lines from data for each class.
- Points plotted for frequencies at midpoints of the class intervals.
- The height of the plotted points corresponds to the class frequency.
- Connected points to create a line graph.
Cumulative Frequency Chart (Ogive)
- Ogive: Shows cumulative frequencies for data classes.
- The x-axis (horizontal) shows upper class boundaries.
- The y-axis (vertical) displays the cumulative frequency.
- Plotted points are connected using a line.
Stem and Leaf Plots
- Stem-and-Leaf Plots: Combine sorting and graphing; used to display data values graphically.
- Uses the first few digits as the stem.
- The remaining digits are called leaves, and they form groups or classes.
- Steps include:
- Arrange data in ascending order.
- Separate data based on the first few digits. Construct the plot.
Studying That Suits You
Use AI to generate personalized quizzes and flashcards to suit your learning preferences.