Podcast
Questions and Answers
What should axes be when creating a bar chart or histogram?
What should axes be when creating a bar chart or histogram?
Clearly marked and labeled
Which of the following is a common graphical method that allows us to determine whether two numerical variables are related in some systematic way?
Which of the following is a common graphical method that allows us to determine whether two numerical variables are related in some systematic way?
- Bar chart
- Histogram
- Scatter plot (correct)
- Line chart
How can a scatter plot incorporate a categorical variable?
How can a scatter plot incorporate a categorical variable?
By using different colors or symbols
What does the number 51 represent for Generation X in the table?
What does the number 51 represent for Generation X in the table?
In a bubble plot, how is the third numerical variable represented?
In a bubble plot, how is the third numerical variable represented?
A ____ column chart is an advanced version of the column chart designed to visualize more than one categorical variable.
A ____ column chart is an advanced version of the column chart designed to visualize more than one categorical variable.
Which of the following are true of line charts? (Select all that apply)
Which of the following are true of line charts? (Select all that apply)
What does each point in a scatter plot represent?
What does each point in a scatter plot represent?
A heat map uses ' ____ ' to display relationships between variables.
A heat map uses ' ____ ' to display relationships between variables.
A scatter plot with a ' ____ variable' includes a third categorical variable.
A scatter plot with a ' ____ variable' includes a third categorical variable.
A ___ plot shows the relationship between three numerical variables.
A ___ plot shows the relationship between three numerical variables.
A ___ chart displays a numerical variable as a series of data points connected by a line.
A ___ chart displays a numerical variable as a series of data points connected by a line.
Which of the following would be a good usage for a heat map? (Select all that apply)
Which of the following would be a good usage for a heat map? (Select all that apply)
The difference between cross-sectional and time series data is whether the data is evaluated at a single point in time or multiple points in time.
The difference between cross-sectional and time series data is whether the data is evaluated at a single point in time or multiple points in time.
Data privacy evaluates moral problems related to data.
Data privacy evaluates moral problems related to data.
Gender is an example of which measurement scale?
Gender is an example of which measurement scale?
Which of the following is true of structured data?
Which of the following is true of structured data?
A good measure of dispersion should consider differences of all observations from the mean.
A good measure of dispersion should consider differences of all observations from the mean.
If the covariance is negative, then x and y have a negative linear relationship.
If the covariance is negative, then x and y have a negative linear relationship.
If the covariance is positive, then x and y have a positive linear relationship.
If the covariance is positive, then x and y have a positive linear relationship.
If the covariance is zero, then x and y have no linear relationship.
If the covariance is zero, then x and y have no linear relationship.
If the correlation coefficient equals -1, then x and y have a perfect negative linear relationship.
If the correlation coefficient equals -1, then x and y have a perfect negative linear relationship.
If the correlation coefficient equals 0, then x and y are not linearly related.
If the correlation coefficient equals 0, then x and y are not linearly related.
If the correlation coefficient equals 1, then x and y have a perfect positive linear relationship.
If the correlation coefficient equals 1, then x and y have a perfect positive linear relationship.
When defining the 3 Vs of big data, 'velocity' refers to the immense amount of data compiled from a single source or a wide range of sources.
When defining the 3 Vs of big data, 'velocity' refers to the immense amount of data compiled from a single source or a wide range of sources.
Examples of categorical variables include: (Select all that apply!)
Examples of categorical variables include: (Select all that apply!)
We refer to the population mean as a ___ and the sample mean as a ___
We refer to the population mean as a ___ and the sample mean as a ___
What type of data collection method involves collecting season records of baseball teams at the end of the season?
What type of data collection method involves collecting season records of baseball teams at the end of the season?
A weakness of 'ordinal data' is that we cannot interpret the difference between the ranked value.
A weakness of 'ordinal data' is that we cannot interpret the difference between the ranked value.
What are the three most widely used measures of central location?
What are the three most widely used measures of central location?
Which of the measures of central location is defined as the middle value of a data set?
Which of the measures of central location is defined as the middle value of a data set?
The only thing that differs between a population mean and a sample mean is the notation. The population mean is referred to as:
The only thing that differs between a population mean and a sample mean is the notation. The population mean is referred to as:
If a variable has one mode, then we say it is ' ____ ' if it has two modes, then it is common to call it ____
If a variable has one mode, then we say it is ' ____ ' if it has two modes, then it is common to call it ____
A percentile is technically a measure of location; how many students had scores lower than your score if you know that the raw score corresponds to the 75th percentile?
A percentile is technically a measure of location; how many students had scores lower than your score if you know that the raw score corresponds to the 75th percentile?
What is the primary measure of central location?
What is the primary measure of central location?
Which numerical descriptive measure shows whether two numerical variables have a linear relationship?
Which numerical descriptive measure shows whether two numerical variables have a linear relationship?
The term ' ____ ' location relates to the way numerical data tend to cluster around some middle or central value.
The term ' ____ ' location relates to the way numerical data tend to cluster around some middle or central value.
Select all of the measures below that are useful for measuring dispersion.
Select all of the measures below that are useful for measuring dispersion.
After arranging the data in ascending order, we calculate the median as (1) the middle value if the number of observations is odd or (2) the average of the two middle values if the number of observations is even.
After arranging the data in ascending order, we calculate the median as (1) the middle value if the number of observations is odd or (2) the average of the two middle values if the number of observations is even.
Which is true of the use of the range as a measure of dispersion?
Which is true of the use of the range as a measure of dispersion?
Which of the measures of central location is defined as the observation that occurs most frequently?
Which of the measures of central location is defined as the observation that occurs most frequently?
What is true of the interquartile range (IQR)?
What is true of the interquartile range (IQR)?
The 25th percentile is referred to as the ' ____ ' quartile, the 50th percentile is referred to as the '____ ' quartile, and the 75th percentile is referred to as the ' ____ ' quartile.
The 25th percentile is referred to as the ' ____ ' quartile, the 50th percentile is referred to as the '____ ' quartile, and the 75th percentile is referred to as the ' ____ ' quartile.
Calculate the Mean Absolute Deviation for the following data: We have observed the age of 3 individuals in a study, where the mean age is 40. The observed ages were 31, 40, and 49. What is the MAD?
Calculate the Mean Absolute Deviation for the following data: We have observed the age of 3 individuals in a study, where the mean age is 40. The observed ages were 31, 40, and 49. What is the MAD?
Measures of which type gauge the underlying variability of the data?
Measures of which type gauge the underlying variability of the data?
Which of the following is true of the variance and standard deviation?
Which of the following is true of the variance and standard deviation?
What measure equals zero if all observations are identical and increases as the observations become more diverse?
What measure equals zero if all observations are identical and increases as the observations become more diverse?
Which of the following are common measures of shape?
Which of the following are common measures of shape?
The ' ____ ' is the simplest measure of dispersion; it is the difference between the maximum and the minimum observations of a variable.
The ' ____ ' is the simplest measure of dispersion; it is the difference between the maximum and the minimum observations of a variable.
The ___ ' range is the difference between the third quartile and the first quartile.
The ___ ' range is the difference between the third quartile and the first quartile.
Which of the following statements is true of the skewness coefficient? Select all that are true.
Which of the following statements is true of the skewness coefficient? Select all that are true.
What does MAD stand for when used as a measure of dispersion?
What does MAD stand for when used as a measure of dispersion?
The ____ coefficient is a summary measure that tells us whether the tails of the distribution are more or less extreme than the normal distribution.
The ____ coefficient is a summary measure that tells us whether the tails of the distribution are more or less extreme than the normal distribution.
The formula for the variance differs depending on whether we have a sample or a ' ____
The formula for the variance differs depending on whether we have a sample or a ' ____
Which of the following is true of measures of association? Select all that are true.
Which of the following is true of measures of association? Select all that are true.
The ___ coefficient measures the degree to which a distribution is not symmetric about its mean.
The ___ coefficient measures the degree to which a distribution is not symmetric about its mean.
Which of the following is true of the covariance? Select all that are true!
Which of the following is true of the covariance? Select all that are true!
Which of the following statements is true regarding the kurtosis coefficient? Select all that are true.
Which of the following statements is true regarding the kurtosis coefficient? Select all that are true.
A measure of ____ quantifies the direction and strength of the linear relationship between two variables, x and y.
A measure of ____ quantifies the direction and strength of the linear relationship between two variables, x and y.
The ' ____ ' coefficient describes both the direction and the strength of the linear relationship between x and y.
The ' ____ ' coefficient describes both the direction and the strength of the linear relationship between x and y.
An objective numerical measure that reveals the direction of the linear relationship between two variables is called the ' ____.
An objective numerical measure that reveals the direction of the linear relationship between two variables is called the ' ____.
Which of the following is a true statement regarding outliers in data analysis? (Choose all that apply)
Which of the following is a true statement regarding outliers in data analysis? (Choose all that apply)
When constructing a box plot, what does the five-number summary contain?
When constructing a box plot, what does the five-number summary contain?
Which of the following is true of the correlation coefficient? Select all that are true!
Which of the following is true of the correlation coefficient? Select all that are true!
The Empirical Rule provides precise statements regarding the percentage of observations that fall within a specified number of standard deviations from the mean. Which of the following is a correct statement? Select all that apply!
The Empirical Rule provides precise statements regarding the percentage of observations that fall within a specified number of standard deviations from the mean. Which of the following is a correct statement? Select all that apply!
Extremely large or small observations for a variable are referred to as ' ____.
Extremely large or small observations for a variable are referred to as ' ____.
During boxplot construction, which of the following must be included? Rank these steps in the correct order.
During boxplot construction, which of the following must be included? Rank these steps in the correct order.
Because almost all observations fall within three standard deviations of the mean, it is common to treat an observation as an ' ___ ' if its z-score is more than 3 or less than −3.
Because almost all observations fall within three standard deviations of the mean, it is common to treat an observation as an ' ___ ' if its z-score is more than 3 or less than −3.
Z-score measures the relative location of an observation and indicates whether it is an outlier.
Z-score measures the relative location of an observation and indicates whether it is an outlier.
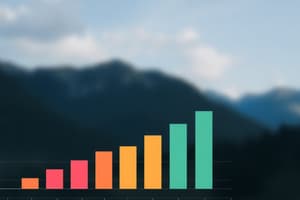
Which 'tool' depicts the frequency or the relative frequency for each category of the categorical variable as a series of horizontal or vertical bars?
Which 'tool' depicts the frequency or the relative frequency for each category of the categorical variable as a series of horizontal or vertical bars?
In a survey with 1000 respondents, if the relative frequency of online teaching proponents was 0.252, how many respondents preferred online teaching?
In a survey with 1000 respondents, if the relative frequency of online teaching proponents was 0.252, how many respondents preferred online teaching?
In a large lecture class of 280 students, if the professor announced that the mean score on an exam is 74 with a standard deviation of 8, how many standard deviations above the mean would a score of 90 be?
In a large lecture class of 280 students, if the professor announced that the mean score on an exam is 74 with a standard deviation of 8, how many standard deviations above the mean would a score of 90 be?
If a bar chart depicts the relative frequency for categories of occupations, and the Doctor bar has a value of 0.4 with 10 employed individuals, how many Doctors were in the group?
If a bar chart depicts the relative frequency for categories of occupations, and the Doctor bar has a value of 0.4 with 10 employed individuals, how many Doctors were in the group?
The mean and standard deviation of scores on an accounting exam are 74 and 8. If a student scores 90 in both classes, what are the z-scores?
The mean and standard deviation of scores on an accounting exam are 74 and 8. If a student scores 90 in both classes, what are the z-scores?
Which of the following are valid methods for visualizing a numerical variable?
Which of the following are valid methods for visualizing a numerical variable?
Converting raw data into a ' ___ ' distribution is often a first step in making the data more manageable.
Converting raw data into a ' ___ ' distribution is often a first step in making the data more manageable.
Which of the following examples violates the 'mutually exclusive' guideline for interval construction?
Which of the following examples violates the 'mutually exclusive' guideline for interval construction?
A frequency distribution for a categorical variable records the number of observations that fall into each category. If 116 chose Audi out of 1000 respondents, what is the relative frequency of Audi respondents?
A frequency distribution for a categorical variable records the number of observations that fall into each category. If 116 chose Audi out of 1000 respondents, what is the relative frequency of Audi respondents?
Which of the following are valid shapes of a histogram?
Which of the following are valid shapes of a histogram?
A vertical bar chart is often referred to as which of the following?
A vertical bar chart is often referred to as which of the following?
For a numerical variable, a _________ distribution groups data into intervals and records the number of observations that fall into each interval.
For a numerical variable, a _________ distribution groups data into intervals and records the number of observations that fall into each interval.
When constructing a graph, the vertical axis SHOULD be stretched so that an increase or decrease appears more pronounced than warranted.
When constructing a graph, the vertical axis SHOULD be stretched so that an increase or decrease appears more pronounced than warranted.
For a numerical variable, what are some guidelines for developing intervals?
For a numerical variable, what are some guidelines for developing intervals?
Contingency tables and stacked column charts are methods that summarize the relationship between two categorical variables.
Contingency tables and stacked column charts are methods that summarize the relationship between two categorical variables.
When constructing a histogram, what does the height of each bar represent? Choose all that are correct responses.
When constructing a histogram, what does the height of each bar represent? Choose all that are correct responses.
When examining the relationship between two categorical variables, a ' ___ ' table proves very useful.
When examining the relationship between two categorical variables, a ' ___ ' table proves very useful.
Which of the following is true of a stacked column chart?
Which of the following is true of a stacked column chart?
A scatter plot is a graphical tool that plots pairs of data. Once the data are plotted, what may the graph reveal? (Select all that apply)
A scatter plot is a graphical tool that plots pairs of data. Once the data are plotted, what may the graph reveal? (Select all that apply)
Select all that apply for the key guidelines for constructing or interpreting charts or graphs.
Select all that apply for the key guidelines for constructing or interpreting charts or graphs.
Flashcards
Cross-sectional Data
Cross-sectional Data
Data evaluated at a single point in time.
Time Series Data
Time Series Data
Data evaluated across multiple time points.
Nominal Measurement Scale
Nominal Measurement Scale
A measurement scale classifying data into distinct categories without implied order.
Categorical Variables
Categorical Variables
Signup and view all the flashcards
Structured Data
Structured Data
Signup and view all the flashcards
Unstructured Data
Unstructured Data
Signup and view all the flashcards
Good Measure of Dispersion
Good Measure of Dispersion
Signup and view all the flashcards
Measures of Central Location
Measures of Central Location
Signup and view all the flashcards
Median
Median
Signup and view all the flashcards
Negative Covariance
Negative Covariance
Signup and view all the flashcards
Positive Covariance
Positive Covariance
Signup and view all the flashcards
The 3 Vs of Big Data
The 3 Vs of Big Data
Signup and view all the flashcards
Velocity (in Big Data)
Velocity (in Big Data)
Signup and view all the flashcards
Percentile
Percentile
Signup and view all the flashcards
Five-Number Summary
Five-Number Summary
Signup and view all the flashcards
Interquartile Range (IQR)
Interquartile Range (IQR)
Signup and view all the flashcards
Mean Absolute Deviation (MAD)
Mean Absolute Deviation (MAD)
Signup and view all the flashcards
Histograms
Histograms
Signup and view all the flashcards
Bar Chart
Bar Chart
Signup and view all the flashcards
Scatter Plots
Scatter Plots
Signup and view all the flashcards
Outliers
Outliers
Signup and view all the flashcards
Z-score
Z-score
Signup and view all the flashcards
Range
Range
Signup and view all the flashcards
Standard Deviation
Standard Deviation
Signup and view all the flashcards
Stacked Column Charts
Stacked Column Charts
Signup and view all the flashcards
Bubble Plot
Bubble Plot
Signup and view all the flashcards
Line Charts
Line Charts
Signup and view all the flashcards
Heatmap
Heatmap
Signup and view all the flashcards
Line charts
Line charts
Signup and view all the flashcards
Bubbles plots
Bubbles plots
Signup and view all the flashcards
Study Notes
Data Types and Definitions
- Cross-sectional data is evaluated at a single point in time, while time series data is evaluated across multiple time points.
- Gender is classified as a nominal measurement scale.
- Categorical variables can include marital status and course grade.
Data Structure and Types
- Structured data includes point-of-sale and financial data.
- Unstructured data includes social media content, which does not conform to a predefined format.
Measures of Dispersion and Central Tendency
- A good measure of dispersion considers all observations' differences from the mean.
- Common measures of central location are mean, median, and mode.
- Median is defined as the middle value in a sorted data set.
Covariance and Correlation
- A negative covariance indicates a negative linear relationship between variables.
- A positive covariance indicates a positive linear relationship.
- A correlation coefficient of -1 signifies a perfect negative linear relationship, while 1 indicates a perfect positive linear relationship.
Big Data Characteristics
- The '3 Vs' of big data include Volume, Variety, and Velocity; 'velocity' refers to the speed at which data is generated and processed.
Percentiles and Box Plots
- A percentile measures relative position; the 75th percentile indicates that 75% of scores fall below that value.
- The five-number summary for a box plot consists of minimum value, Q1, median (Q2), Q3, and maximum value.
Measures of Variability
- The interquartile range (IQR) is calculated as Q3 minus Q1, indicating the range of the middle 50% of the data.
- The Mean Absolute Deviation (MAD) quantifies the average distance of observations from the mean.
Graphical Representations
- Histograms can show the frequency or relative frequency of data intervals.
- A bar chart visually represents categorical data as bars of proportional length.
- Scatter plots illustrate relationships between two numerical variables, with potential incorporation of a categorical variable through color or symbols.
Outliers and Data Analysis
- Outliers are extreme observations and can indicate data inaccuracies or natural anomalies.
- The z-score helps detect outliers by measuring how many standard deviations an observation is from the mean.
Statistical Interpretation
- The range is the simplest measure of dispersion, calculated as maximum value minus minimum value.
- The variance is a measure of the spread of data; the standard deviation is the square root of the variance.
Graphical Presentation Guidelines
- Effective graphs should have clearly marked axes, and similar bars/rectangles should be used for consistency.
- Stacked column charts compare composition across categories and visualize multiple categorical variables.
Bubble and Line Plots
- In a bubble plot, the size of the bubble represents a third variable, adding depth to data interpretation.
- Line charts represent data points connected by lines, suitable for showing trends over time.
Summary Interpretation
- Answers to questions about data types, measures, relationships between variables, and specific calculations can be derived from statistical principles and graphical analysis methods.### Graphical Tools in Data Visualization
- Tracking changes or trends over time can be effectively represented using line charts.
- Multiple lines can be plotted on a single chart to compare different data sets.
Scatter Plots
- Scatter plots are used to examine the relationship between two numerical variables.
- Each point in a scatter plot represents a paired observation, defined by coordinates (x1, y1).
Heat Maps
- Heat maps utilize color to visually display relationships between variables.
- They are effective in representing complex data that is difficult to analyze through raw data inspection.
Categorical Variables in Scatter Plots
- When incorporating a third variable that is categorical, the plot is referred to as a scatter plot with a categorical variable.
Bubble Plots
- Bubble plots illustrate the relationship between three numerical variables using circles (bubbles) to represent values and sizes.
Line Charts
- Line charts connect a series of data points with lines, effectively displaying trends in a numerical variable over time.
Applications of Heat Maps
- Heat maps can track the best and worst-selling products across different stores.
- They can identify inventory items needing replenishment while monitoring abundant stock levels.
- Usage includes analyzing frequently downloaded music genres across various streaming platforms, shedding light on consumer preferences.
Studying That Suits You
Use AI to generate personalized quizzes and flashcards to suit your learning preferences.