Podcast
Questions and Answers
What does an R-squared value of 0.60 imply about a regression model?
What does an R-squared value of 0.60 imply about a regression model?
- The independent variable has a negative effect on the dependent variable.
- The model has no explanatory power.
- The model is perfect in explaining the dependent variable.
- The model explains 60% of the variation in the dependent variable. (correct)
What does a negative coefficient for an independent variable indicate?
What does a negative coefficient for an independent variable indicate?
- There is no relationship between the independent and dependent variable.
- The dependent variable decreases as the independent variable increases. (correct)
- The dependent variable increases regardless of the independent variable.
- The dependent variable remains unchanged as the independent variable increases.
In the regression equation Weight Loss (kg)=2+0.8×Hours in Fitness, what does the intercept represent?
In the regression equation Weight Loss (kg)=2+0.8×Hours in Fitness, what does the intercept represent?
- The total weight loss influenced by diet alone.
- The expected weight loss when hours in fitness is zero. (correct)
- The maximum weight loss achievable in the program.
- The weight loss when a patient spends 10 hours in the program.
What can be inferred if the R-squared value of a model is closer to 0?
What can be inferred if the R-squared value of a model is closer to 0?
If a regression model has an R-squared value of 0.90, what does this suggest about other factors affecting the dependent variable?
If a regression model has an R-squared value of 0.90, what does this suggest about other factors affecting the dependent variable?
How would increasing the R-squared value of a regression model most likely be achieved?
How would increasing the R-squared value of a regression model most likely be achieved?
What does a Pearson Correlation Coefficient (r) of +1 indicate?
What does a Pearson Correlation Coefficient (r) of +1 indicate?
Which of the following statements about correlation and causation is true?
Which of the following statements about correlation and causation is true?
What is the primary purpose of regression analysis?
What is the primary purpose of regression analysis?
In the context of correlation, what type of relationship does a negative correlation indicate?
In the context of correlation, what type of relationship does a negative correlation indicate?
What does a Pearson Correlation Coefficient (r) value of 0 signify?
What does a Pearson Correlation Coefficient (r) value of 0 signify?
Which of the following is NOT a type of correlation mentioned?
Which of the following is NOT a type of correlation mentioned?
How does regression differ from correlation?
How does regression differ from correlation?
Which example best illustrates a positive correlation?
Which example best illustrates a positive correlation?
If variables A and B exhibit a perfect positive correlation, what can be said about them?
If variables A and B exhibit a perfect positive correlation, what can be said about them?
What does the regression line represent in regression analysis?
What does the regression line represent in regression analysis?
In the equation of linear regression, what does 'b1' represent?
In the equation of linear regression, what does 'b1' represent?
What does the error term 'e' in the simple linear regression equation account for?
What does the error term 'e' in the simple linear regression equation account for?
What distinguishes multiple linear regression from simple linear regression?
What distinguishes multiple linear regression from simple linear regression?
In the regression analysis context, what does residual error refer to?
In the regression analysis context, what does residual error refer to?
Which term best describes the independent variables in a multiple regression analysis?
Which term best describes the independent variables in a multiple regression analysis?
What does the bracket notation 'ŷ' represent in the equation ŷ = ax + b?
What does the bracket notation 'ŷ' represent in the equation ŷ = ax + b?
In regression analysis, what is meant by 'best-fit line'?
In regression analysis, what is meant by 'best-fit line'?
What does the term 'dependent variable' refer to in regression analysis?
What does the term 'dependent variable' refer to in regression analysis?
Flashcards
Regression Analysis
Regression Analysis
The process of predicting the value of a dependent variable (Y) using an independent variable (X).
Dependent Variable
Dependent Variable
The main factor you're trying to understand or predict in a regression analysis.
Independent Variable
Independent Variable
Factors you believe influence the dependent variable in a regression analysis.
Regression Line
Regression Line
Signup and view all the flashcards
Linear Regression
Linear Regression
Signup and view all the flashcards
Residual Error
Residual Error
Signup and view all the flashcards
Simple Linear Regression
Simple Linear Regression
Signup and view all the flashcards
Intercept (b0)
Intercept (b0)
Signup and view all the flashcards
Slope (b1)
Slope (b1)
Signup and view all the flashcards
Multiple Linear Regression
Multiple Linear Regression
Signup and view all the flashcards
What is R-squared?
What is R-squared?
Signup and view all the flashcards
What does a coefficient tell us?
What does a coefficient tell us?
Signup and view all the flashcards
What is the 'intercept'?
What is the 'intercept'?
Signup and view all the flashcards
What does a regression coefficient represent?
What does a regression coefficient represent?
Signup and view all the flashcards
When does a model have a 'good' R-squared?
When does a model have a 'good' R-squared?
Signup and view all the flashcards
What is the range of possible values for R-squared?
What is the range of possible values for R-squared?
Signup and view all the flashcards
Correlation
Correlation
Signup and view all the flashcards
Positive Correlation
Positive Correlation
Signup and view all the flashcards
Negative Correlation
Negative Correlation
Signup and view all the flashcards
No Correlation
No Correlation
Signup and view all the flashcards
Pearson Correlation Coefficient (r)
Pearson Correlation Coefficient (r)
Signup and view all the flashcards
Regression
Regression
Signup and view all the flashcards
Regression Technique
Regression Technique
Signup and view all the flashcards
Study Notes
Correlation and Regression
- Inferential statistics allow predictions based on sample data.
- Key goals of correlation and regression are to determine relationships between variables and make predictions from data trends.
- Real-world examples include the relationship between study hours and exam scores, and predicting sales based on advertising spend.
Correlation
- Correlation measures the strength and direction of a relationship between two variables.
- Correlation is used in bivariate analysis.
- Types of Correlation:
- Positive Correlation: One variable increases, the other increases (e.g., height and weight).
- Negative Correlation: One variable increases, the other decreases (e.g., exercise and weight loss).
- No Correlation: No consistent relationship exists (e.g., shoe size and test scores).
- Correlation does not imply causation.
How to Measure Correlation
- Pearson Correlation Coefficient (r): measures the strength and direction of linear relationships between continuous variables.
- Sign of r denotes the association's nature.
- Value of r denotes the strength of the association.
- Range: -1 to +1
- +1: Perfect positive correlation
- -1: Perfect negative correlation
- 0: No correlation
Regression
- Correlation shows a relationship, but regression quantifies it and allows predictions.
- Regression tells us how to draw the straight line described by the correlation.
- The regression technique predicts some variables by knowing others.
- It derives a mathematical equation to predict one parameter knowing the value of the other parameter.
- Example: Knowing the relationship between study hours and grades, regression predicts grades based on study hours.
Regression Analysis
- The process of predicting a dependent variable (Y) using an independent variable (X).
- To understand regression analysis, understand:
- Dependent Variable: The main factor to understand or predict.
- Independent Variables: Factors hypothesized to impact the dependent variable.
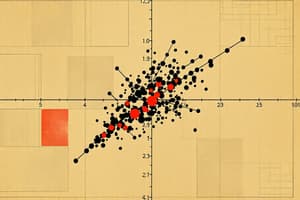
Regression Analysis: Drawing a line
- Draw a line through the middle of all data points on a chart
- This is known as the regression line
- The regression line represents the relationship between the independent variable and the dependent variable
Best-Fit Line
- Linear regression aims to fit a straight line, ŷ = ax+b, to data that gives the best prediction of y for any value of x.
- The line minimizes the distance (residuals) between data and the fitted line.
Types of Regression: Simple Linear Regression
- One independent variable predicts a dependent variable (continuous).
- Equation: y=b0+b1x+e
- y: Dependent variable
- x: Independent variable
- b0: Intercept
- b1: Slope (change in y for a one-unit change in x)
- e: Error term
Types of Regression: Multiple Linear Regression
- Multiple regression determines the effect of multiple independent variables on a single dependent variable.
- The different independent variables are combined linearly, each with its own regression coefficient.
Interpreting Regression Output: R-squared (R²)
- R² tells us how well the independent variable(s) explain variation in the dependent variable.
- Range: 0 to 1
- Closer to 1: The model explains most of the variation.
- Closer to 0: The model explains very little variation.
Interpreting Regression Output: Coefficients
- Coefficients of independent variables indicate how much the dependent variable changes for each one-unit increase in the independent variable.
- Positive coefficient: Y increases as X increases
- Negative coefficient: Y decreases as X increases
Studying That Suits You
Use AI to generate personalized quizzes and flashcards to suit your learning preferences.