Podcast
Questions and Answers
What is the definition of positive correlation?
What is the definition of positive correlation?
- Overall the set of points decreases from left to right
- No correlation exists
- A relationship with no cause and effect
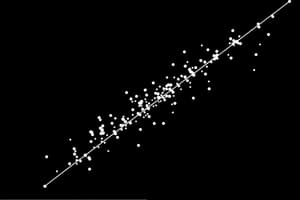
- Overall the set of points increases from left to right with a linear trend (correct)
What does negative correlation indicate?
What does negative correlation indicate?
- Overall the set of points increases from left to right
- A relationship in which one of the variables caused the other
- A smooth line reflecting the general pattern in a graph
- Overall the set of points decreases from left to right with a linear trend (correct)
No correlation means that the set of points is evenly distributed with no linear trend.
No correlation means that the set of points is evenly distributed with no linear trend.
True (A)
What is a trend line?
What is a trend line?
What is the line of best fit?
What is the line of best fit?
What does the correlation coefficient tell you?
What does the correlation coefficient tell you?
What is causation?
What is causation?
What does association refer to in statistics?
What does association refer to in statistics?
Flashcards are hidden until you start studying
Study Notes
Scatterplots and Linear Correlation
-
Positive Correlation: As one variable increases, the other variable also tends to increase, forming an upward trend from left to right on a scatter plot.
-
Negative Correlation: Indicates that as one variable increases, the other variable tends to decrease, resulting in a downward trend from left to right on a scatter plot.
-
No Correlation: The points on the scatter plot are randomly distributed with no discernible pattern, indicating that a linear function is not suitable for modeling the relationship between the variables.
-
Trend Line: A graphic tool added to scatter plots to illustrate the direction of the correlation between two datasets, helping to visualize the relationship.
-
Line of Best Fit: This is a smoothed line that closely follows the general trend of the data points in a graph, providing a clear representation of the data's overall pattern.
-
Correlation Coefficient: A statistical measure that quantifies the strength and direction of a relationship between two variables. A higher absolute value indicates a stronger correlation.
-
Causation: Refers to a scenario where changes in one variable directly result in changes in another variable, establishing a cause-and-effect relationship.
-
Association: A term used to describe a relationship between two variables where changes in one do not directly cause changes in the other but show some form of connection.
Studying That Suits You
Use AI to generate personalized quizzes and flashcards to suit your learning preferences.