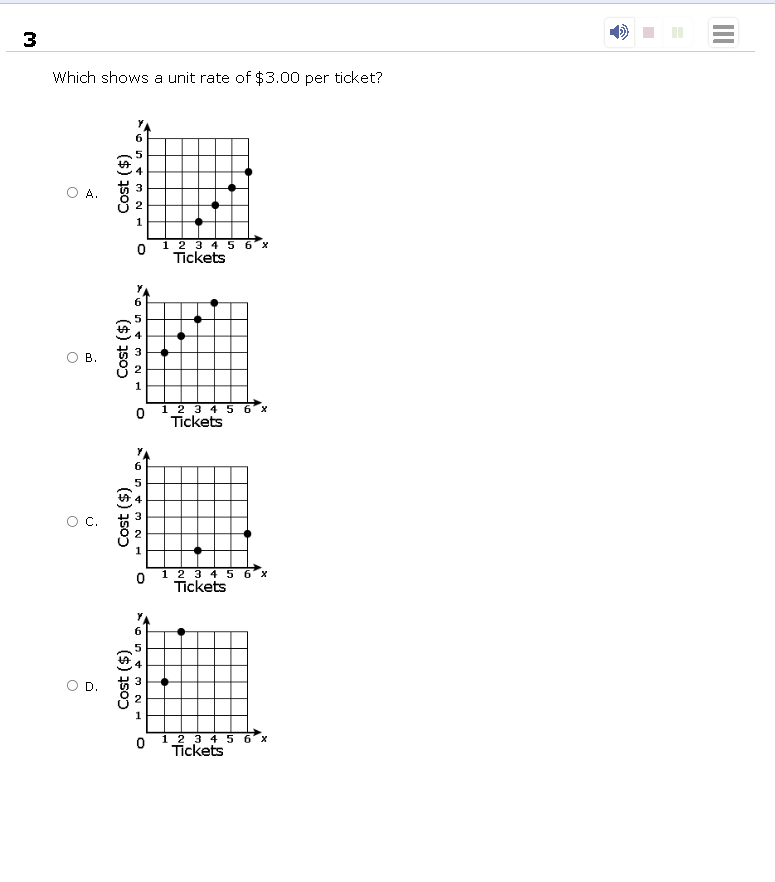
Which shows a unit rate of $3.00 per ticket?

Understand the Problem
The question is asking which of the given graphs represents a unit rate of $3.00 per ticket. To determine this, we need to analyze the relationship between the cost and the number of tickets in each graph.
Answer
Graph A
Answer for screen readers
The correct answer is Graph A.
Steps to Solve
-
Understand the Unit Rate Requirement
A unit rate of $3.00 per ticket means that for each ticket purchased, the cost must increase by $3.00. We will look for a graph where the cost increases by $3.00 for each increase of one ticket. -
Evaluate Each Graph
Check each graph to see if the cost changes appropriately with an increase in the number of tickets.- Graph A: At 3 tickets, the cost is $9.00, which gives $9.00 / 3 tickets = $3.00 per ticket.
- Graph B: At 2 tickets, the cost is $6.00, which gives $6.00 / 2 tickets = $3.00 per ticket.
- Graph C: At 4 tickets, the cost is $8.00, which gives $8.00 / 4 tickets = $2.00 per ticket.
- Graph D: At 2 tickets, the cost is $4.00, which gives $4.00 / 2 tickets = $2.00 per ticket.
-
Identify the Correct Graph
From the evaluations, both Graph A and Graph B show a unit rate of $3.00 per ticket. However, only one of these satisfies the requirement of showing the consistent unit rate as the number of tickets increases. -
Select the Most Consistent Graph
Graph A consistently shows an increase in cost that relates directly to the number of tickets purchased.
The correct answer is Graph A.
More Information
Graphs that depict a consistent unit rate allow us to easily visualize relationships between two variables, like cost and quantity. Here, a unit rate is calculated by dividing the total cost by the number of tickets.
Tips
A common mistake is misreading the graphs or calculating the unit rate incorrectly. Ensure each step is calculated individually and correctly attribute the costs to the appropriate quantity of tickets.
AI-generated content may contain errors. Please verify critical information