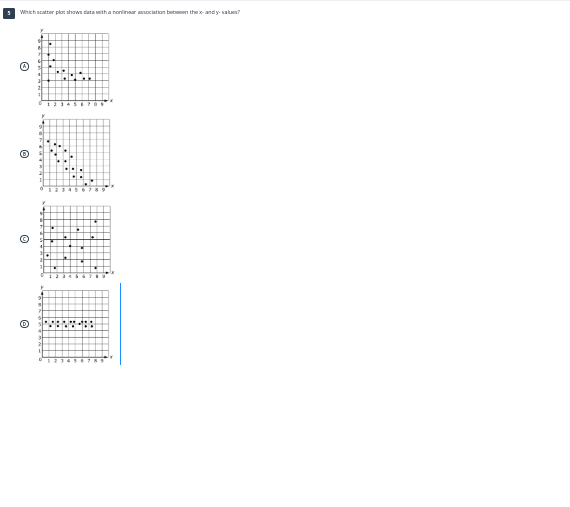
Which scatter plot shows data with a non-linear association between the x and y values?

Understand the Problem
The question is asking which scatter plot demonstrates a non-linear relationship between the x and y values. It requires analyzing the given plots to identify the one that does not show a straight-line pattern.
Answer
Plot C.
Answer for screen readers
The scatter plot that demonstrates a non-linear relationship is Plot C.
Steps to Solve
-
Identify the Types of Relationships Determine the nature of the relationships displayed in each scatter plot, looking for linear versus non-linear associations.
-
Analyze Each Plot Review each scatter plot one by one:
- Plot A: Check if the points appear to align in a straight line.
- Plot B: Observe if the points cluster around a linear trend.
- Plot C: Look for any curvature or deviation from a straight line.
- Plot D: Again, assess whether the points show a linear pattern.
-
Determine Non-linear Relationships Focus on the plot that does not adhere to a straight-line pattern. Non-linear relationships may show curves, clusters, or scattered patterns without a clear linear trend.
-
Select the Appropriate Plot After analyzing all the plots, select the one that exhibits the non-linear relationship.
The scatter plot that demonstrates a non-linear relationship is Plot C.
More Information
Scatter plots are useful for visualizing the relationship between two variables. A non-linear relationship indicates that changes in one variable do not result in consistent changes in the other, often illustrated through curves or clusters.
Tips
- Confusing linear and non-linear relationships: Ensure you closely observe the patterns formed by the points.
- Overlooking subtle curvature: Even slight deviations from a straight line can indicate non-linearity.
AI-generated content may contain errors. Please verify critical information