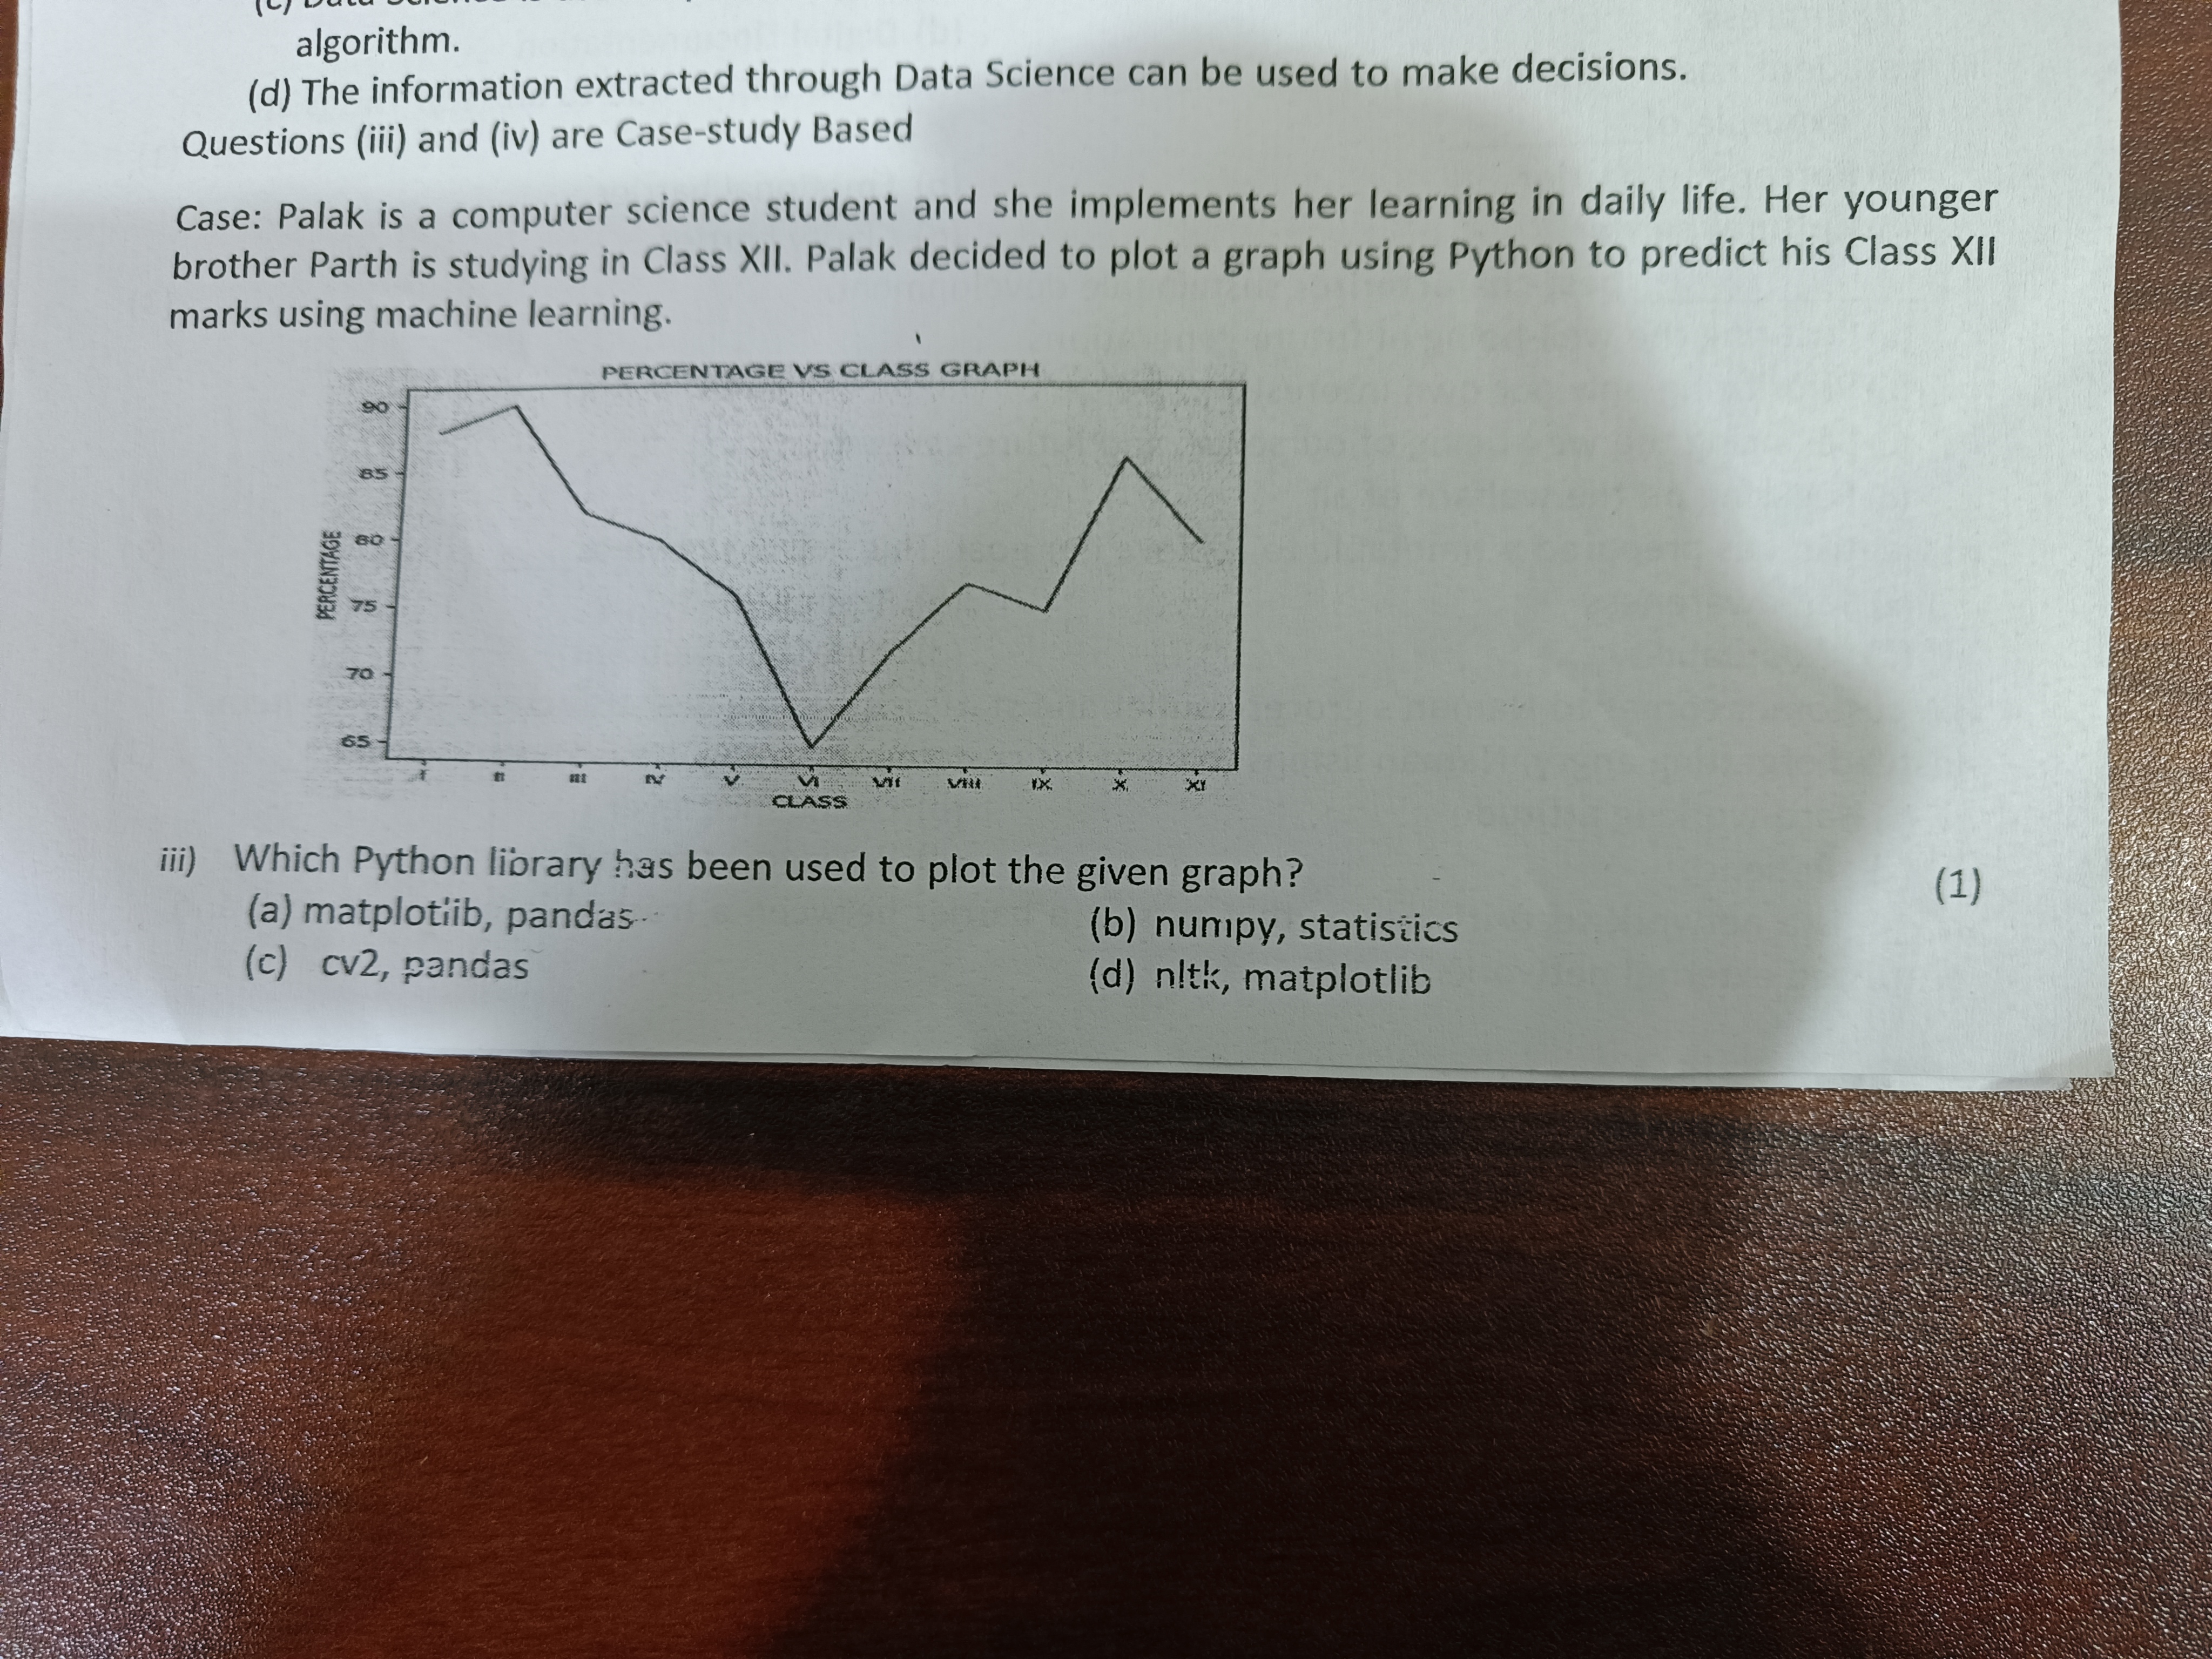
Which Python library has been used to plot the given graph?

Understand the Problem
The question is asking which Python library was used to plot a given graph related to percentages and class marks, providing multiple choice options.
Answer
matplotlib, pandas
The final answer is matplotlib, pandas.
Answer for screen readers
The final answer is matplotlib, pandas.
More Information
Matplotlib is widely used for plotting graphs in Python due to its capability to create static, animated, and interactive visualizations. Pandas often complements Matplotlib by handling data operations effectively.
Tips
A common mistake is confusing libraries for different purposes; ensure the libraries are suited for plotting.
Sources
- Data visualization in Python - Simplilearn - simplilearn.com
- Matplotlib — Visualization with Python - matplotlib.org
AI-generated content may contain errors. Please verify critical information