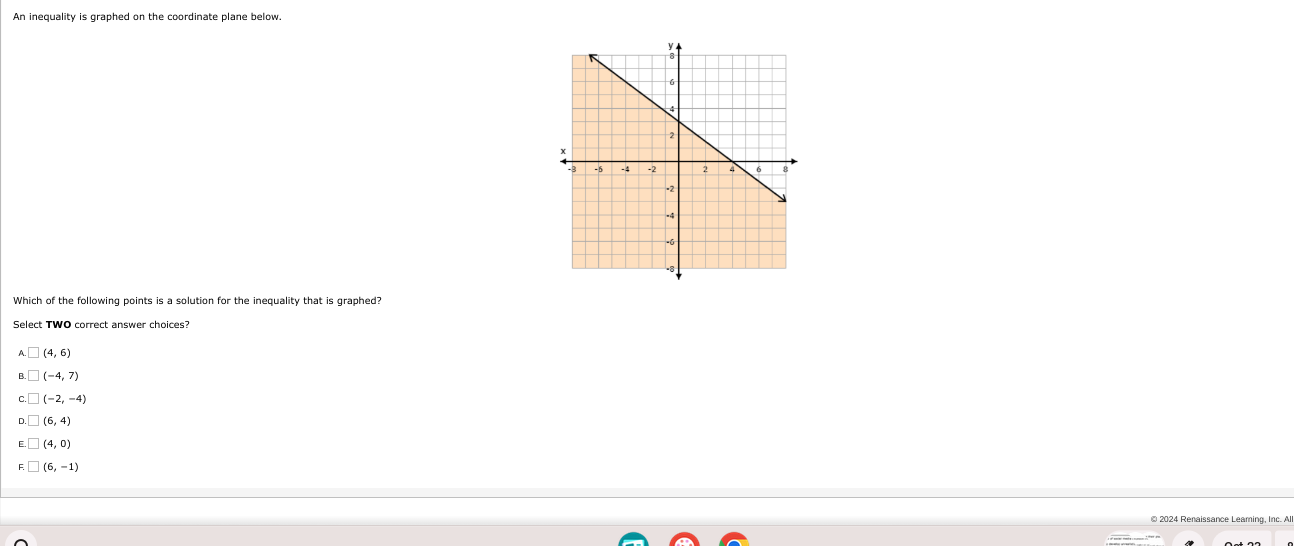
Which of the following points is a solution for the inequality that is graphed? Select TWO correct answer choices?

Understand the Problem
The question is asking which two points are solutions to the graphed inequality on the coordinate plane. The user needs to analyze the graph and select the points that fall within the shaded region.
Answer
The two points that satisfy the inequality are $(4, 0)$ and $(6, -1)$.
Answer for screen readers
The points that are solutions for the inequality are $(4, 0)$ and $(6, -1)$.
Steps to Solve
-
Identify the Shaded Region The graph shows a linear inequality with a shaded region. The points in this shaded area are solutions to the inequality.
-
Understand the Boundary Line The boundary line appears to be solid, indicating that the inequality includes points on the line. If it were dashed, it would exclude those points. The equation can be derived from identifying the intercepts or slope of the line.
-
Boundary Line Equation Assuming the boundary line intersects the y-axis at 4 and goes down to the right, its approximate form can be derived. For instance, the line could be expressed as $y = -x + b$. By identifying two points (like (0, 4) and (4, 0)), we can calculate the slope.
-
Test Given Points Substituting each point into the derived inequality:
- Point A: $(4, 6)$
- Point B: $(-4, 7)$
- Point C: $(-2, -4)$
- Point D: $(6, 4)$
- Point E: $(4, 0)$
- Point F: $(6, -1)$
Determine if these points satisfy the inequality by testing against the boundary equation.
- Determine Valid Solutions Identify which two points fall within the shaded region by confirming if they satisfy the inequality determined.
The points that are solutions for the inequality are $(4, 0)$ and $(6, -1)$.
More Information
The points selected must lie in the shaded region of the graph, indicating they satisfy the inequality represented by the boundary line.
Tips
- Misinterpreting the type of boundary line (solid vs. dashed).
- Failing to test all points or misunderstanding the inequality's direction.
AI-generated content may contain errors. Please verify critical information