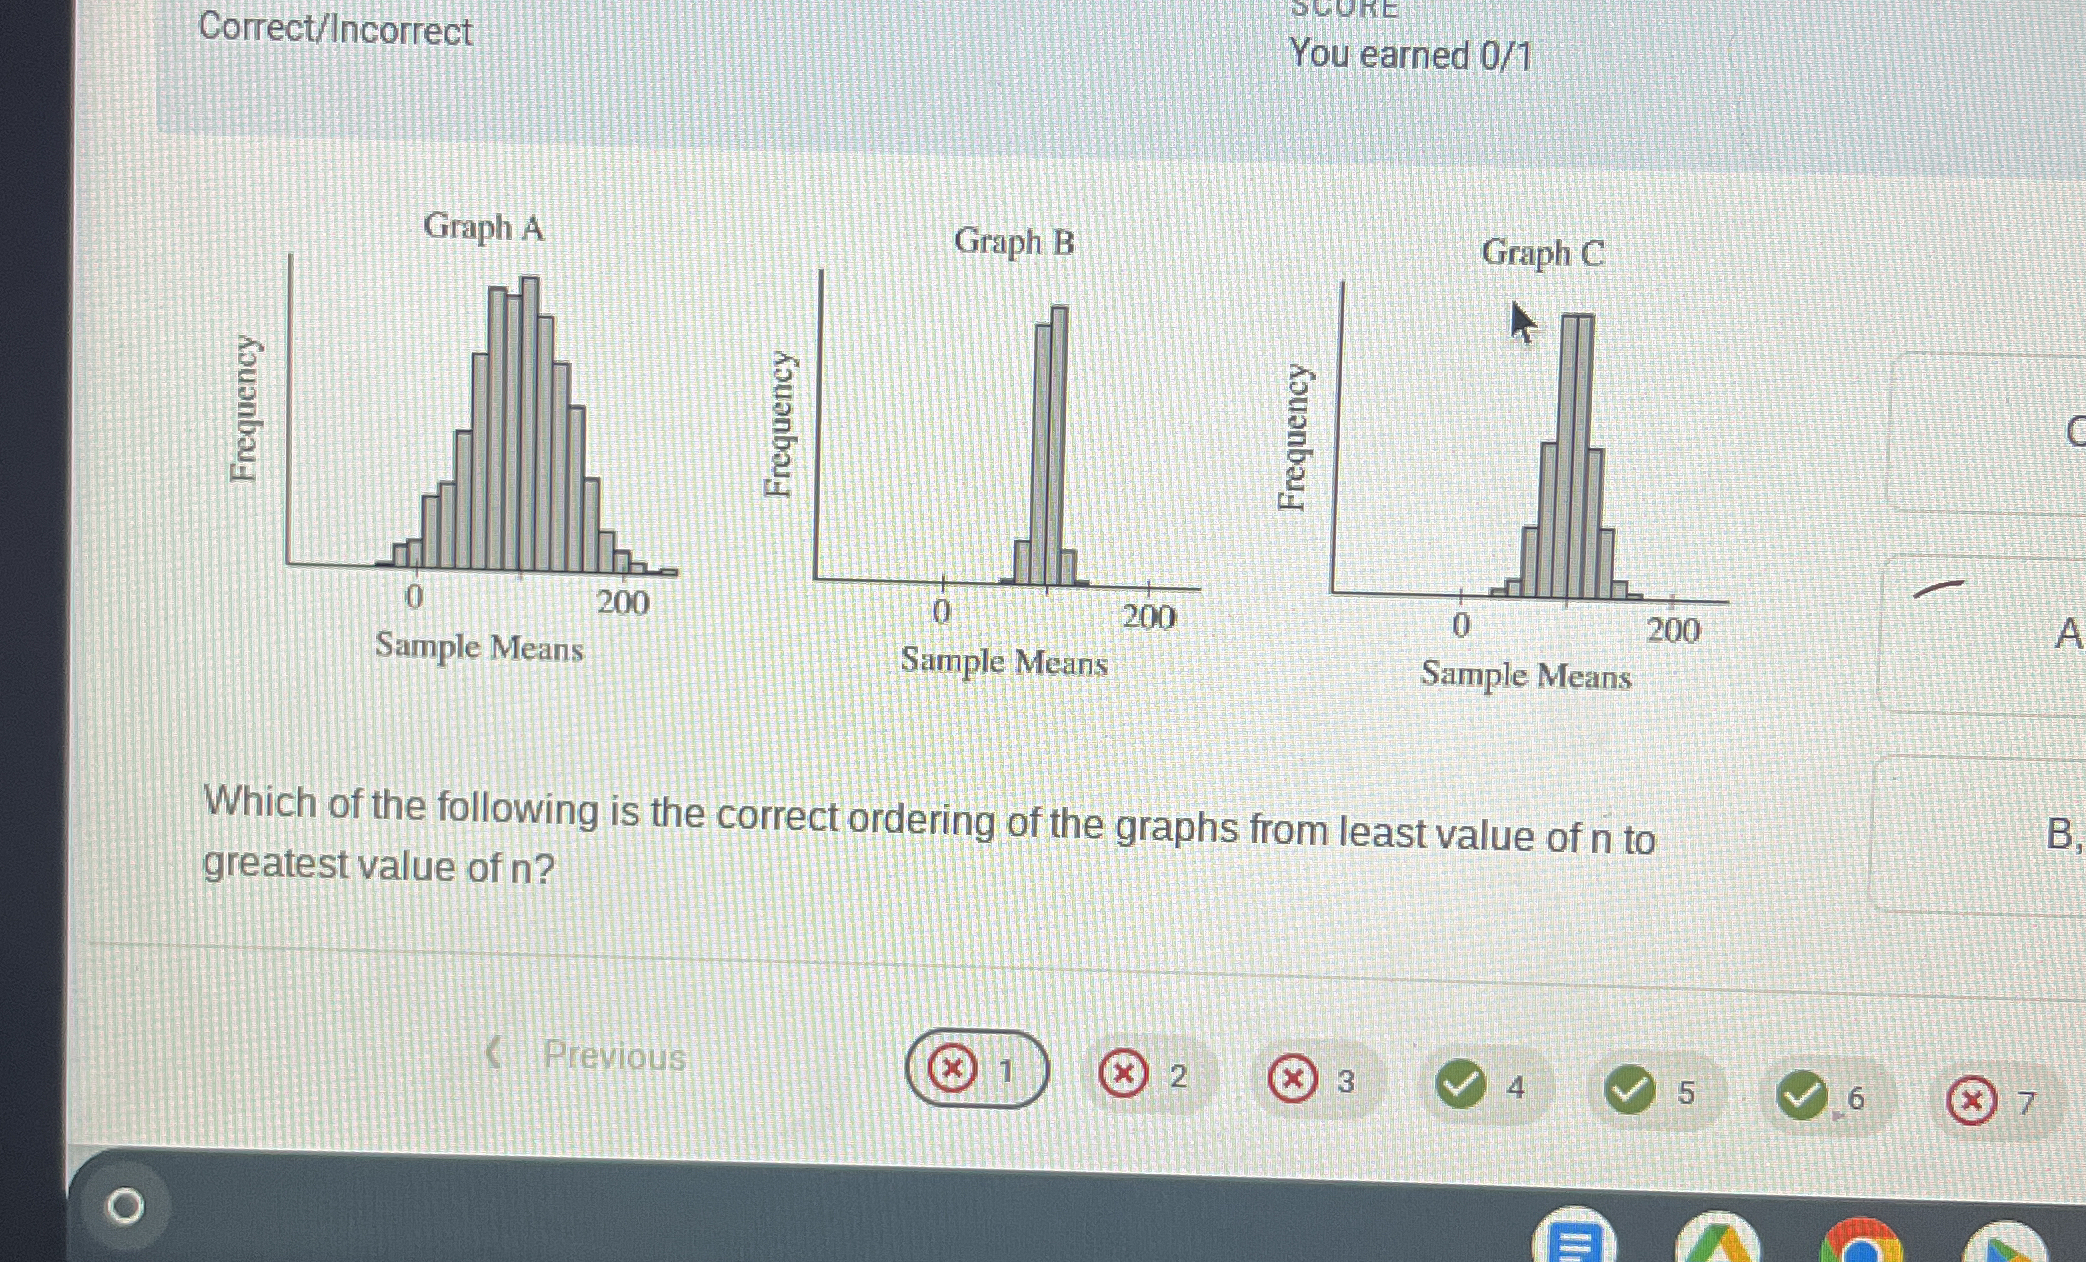
Which of the following is the correct ordering of the graphs from least value of n to greatest value of n?
Understand the Problem
The question is asking to determine the correct ordering of the provided graphs based on the value of 'n', specifically from the least value to the greatest value. This relates to understanding the relationship between sample size and the shape of sampling distributions illustrated in the graphs.
Answer
C, A, B
The correct ordering from least value of n to greatest value of n is C, A, B.
Answer for screen readers
The correct ordering from least value of n to greatest value of n is C, A, B.
More Information
The ordering of graphs is determined by the variability and spread of the sample means. Greater n typically results in less variability and a narrower spread.
Tips
A common mistake is not considering the width and symmetry of the distribution, which are key indicators of sample size.
Sources
AI-generated content may contain errors. Please verify critical information