What's the trend?
Understand the Problem
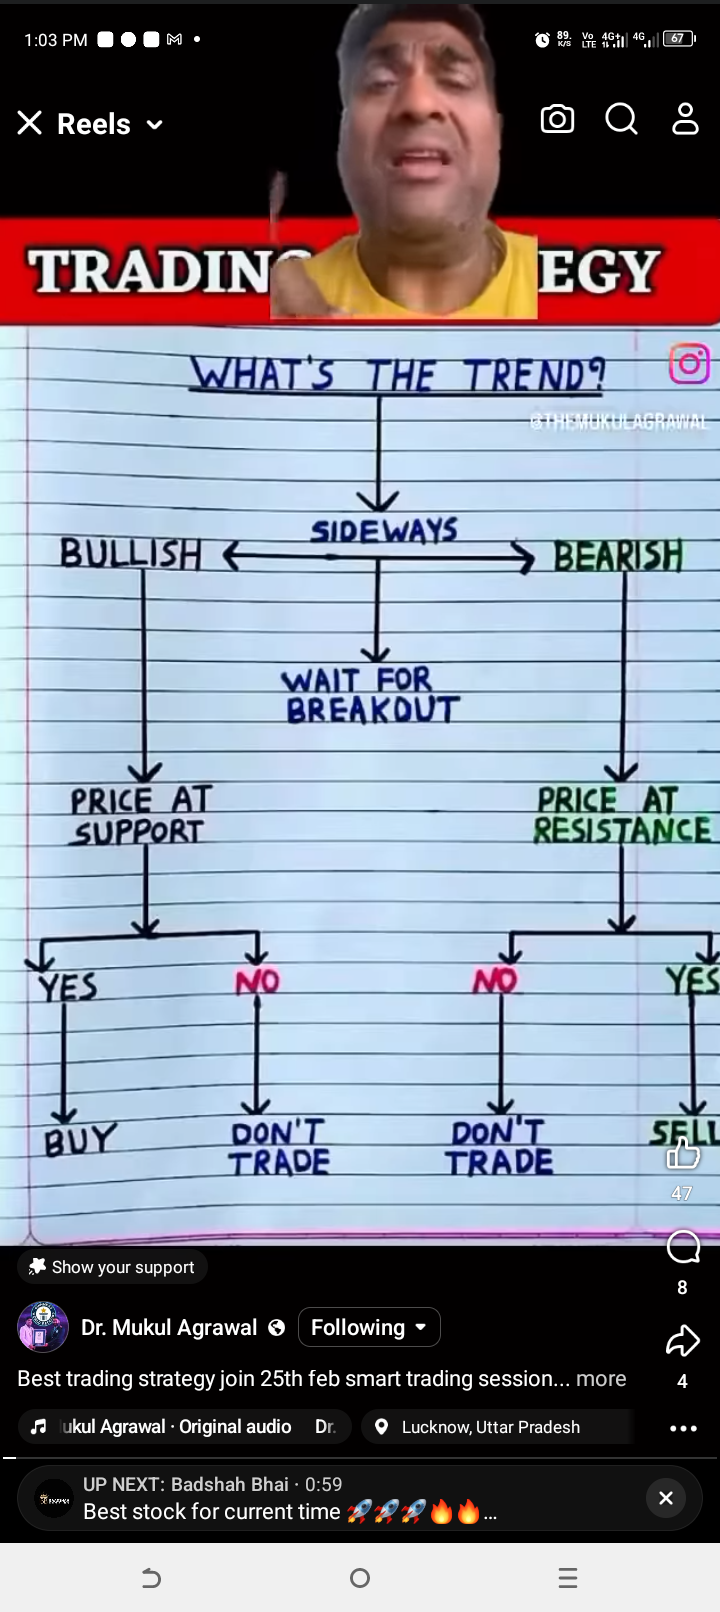
The image presents a flowchart to determine whether to buy or sell stocks based on market trends (bullish, sideways, or bearish) and whether the price is at support or resistance levels. It's a trading strategy guide.
Answer
The image outlines a trading strategy based on market trends: buy in bullish markets at support, sell in bearish markets at resistance, and wait for a breakout in sideways trends.
The image shows a flow chart for a trading strategy. If the trend is bullish and the price is at support, then buy. If the trend is sideways, wait for a breakout. If the trend is bearish and the price is at resistance, then sell.
Answer for screen readers
The image shows a flow chart for a trading strategy. If the trend is bullish and the price is at support, then buy. If the trend is sideways, wait for a breakout. If the trend is bearish and the price is at resistance, then sell.
More Information
Trends are a general shift in how people think, feel, and behave. Recognizing trends can be useful in making financial decisions.
Tips
It is important to be aware of the current trend before making any trades.
Sources
- What is a trend? - WGSN - wgsn.com
AI-generated content may contain errors. Please verify critical information