What is the slope of this graph?
Understand the Problem
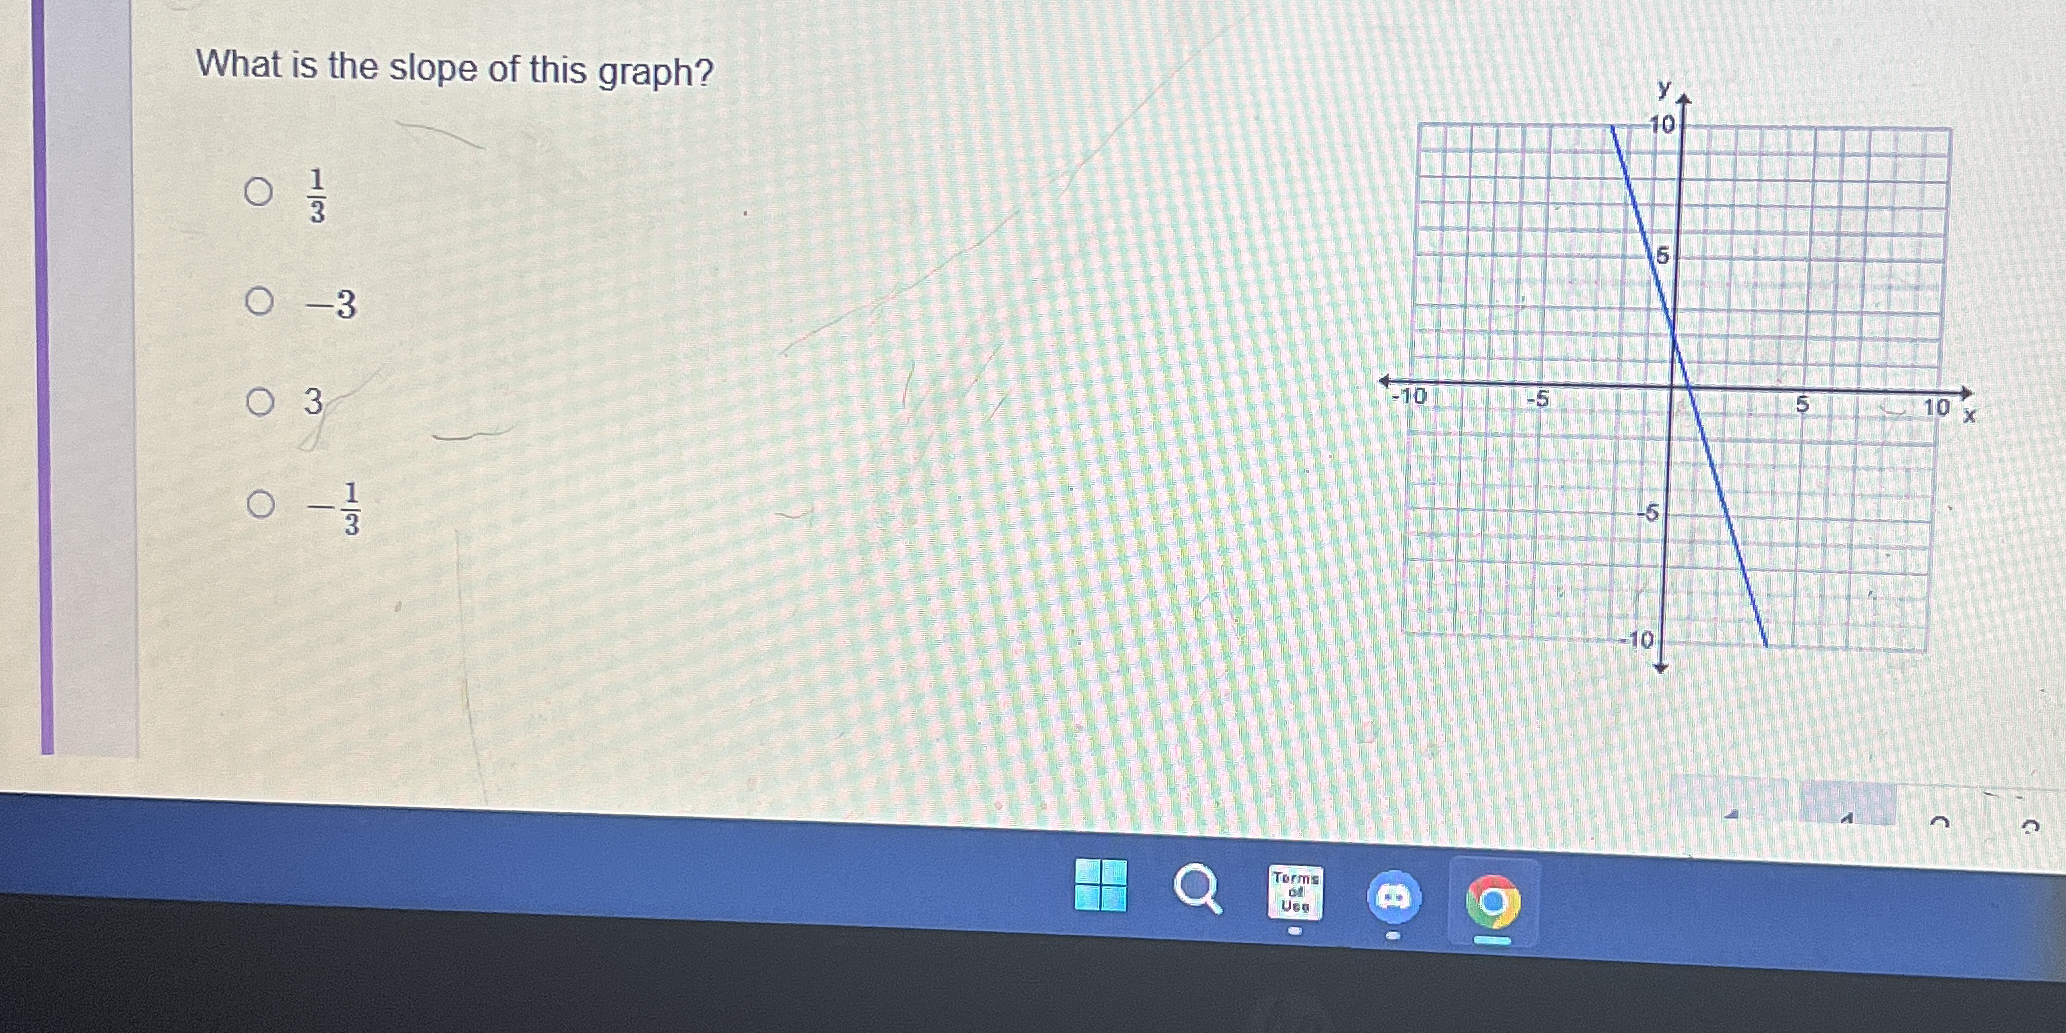
The question is asking to determine the slope of the line represented in the graph provided. To solve it, we will typically use the formula for slope (rise over run), or identify points on the line and calculate based on their coordinates.
Answer
The slope of the graph is $-\frac{5}{3}$.
Answer for screen readers
The slope of the graph is $-\frac{5}{3}$.
Steps to Solve
-
Identify Two Points on the Line Locate two clear points on the line. From the graph, let's say we identify the points $(0, 5)$ and $(3, 0)$.
-
Calculate the Rise and Run To find the slope, calculate the rise (change in $y$) and the run (change in $x$) between the two points:
- Rise = $y_2 - y_1 = 0 - 5 = -5$
- Run = $x_2 - x_1 = 3 - 0 = 3$
-
Use the Slope Formula The formula for slope, $m$, is given by: $$ m = \frac{\text{rise}}{\text{run}} $$ Plugging in the values we calculated: $$ m = \frac{-5}{3} $$
-
Determine the Slope This means the slope of the line is $-\frac{5}{3}$.
The slope of the graph is $-\frac{5}{3}$.
More Information
The slope of a line indicates its steepness and direction. A negative slope means that as $x$ increases, $y$ decreases, which is consistent with this graph featuring a downward slant from left to right.
Tips
Common mistakes when calculating slopes include:
- Choosing points that are not on the line.
- Not correctly subtracting the coordinates of the points (keeping careful track of the signs).
- Confusing rise and run.
AI-generated content may contain errors. Please verify critical information