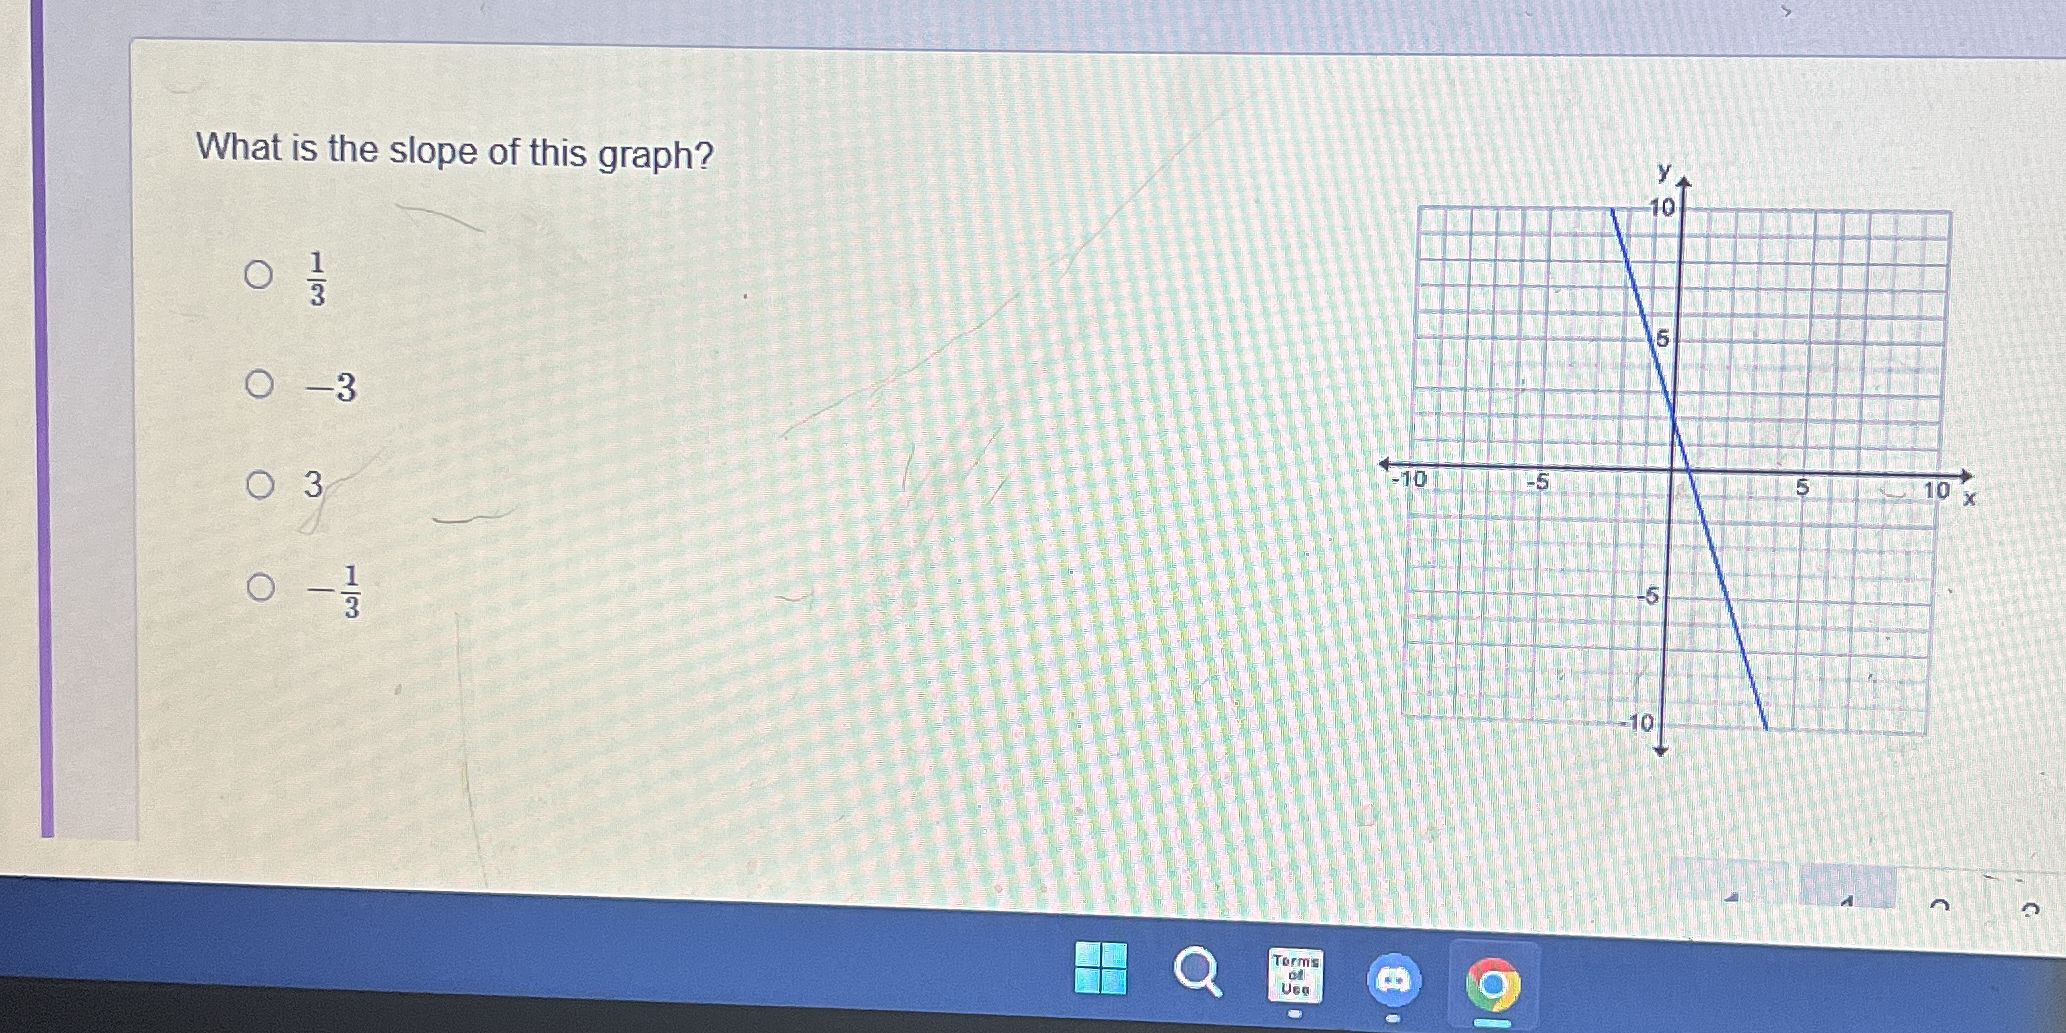
What is the slope of this graph?
Understand the Problem
The question is asking for the slope of a line represented in a graph. To determine this, we understand that the slope can be calculated by identifying the rise over run between two points on the line.
Answer
The slope of the graph is $-1$.
Answer for screen readers
The slope of the graph is $-1$.
Steps to Solve
-
Identify Points on the Line Determine two points on the line from the graph. For example, let's say we have points A (1, 3) and B (4, 0).
-
Calculate the Rise Calculate the change in the y-coordinates (vertical change) between the two points. Using our example: $$ \text{Rise} = y_2 - y_1 = 0 - 3 = -3 $$
-
Calculate the Run Calculate the change in the x-coordinates (horizontal change) between the two points. Using our example: $$ \text{Run} = x_2 - x_1 = 4 - 1 = 3 $$
-
Calculate the Slope The slope (m) can be calculated using the formula: $$ m = \frac{\text{Rise}}{\text{Run}} $$ Using our example: $$ m = \frac{-3}{3} = -1 $$
The slope of the graph is $-1$.
More Information
In this case, the slope indicates that for every 3 units you move to the right (positive x-direction), the line moves down 3 units (negative y-direction).
Tips
- Ignoring signs: Sometimes the rise or run can be negative, leading to incorrect slope calculations. Always consider the direction of movement.
- Choosing points incorrectly: Make sure to select clear points on the line that are easy to read and ensure they are distinct.
AI-generated content may contain errors. Please verify critical information