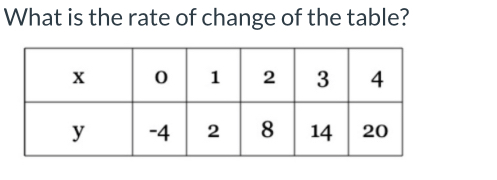
What is the rate of change of the table?

Understand the Problem
The question is asking for the rate of change based on the values presented in the table for x and y. We will determine the rate of change by examining how y changes in relation to x.
Answer
The rate of change of the table is $6$.
Answer for screen readers
The rate of change of the table is $6$.
Steps to Solve
- Identify the changes in x and y
We will calculate the change in $y$ for each change in $x$. The values from the table are:
- For $x = 0 \rightarrow 1$, $y$ changes from $-4$ to $2$
- For $x = 1 \rightarrow 2$, $y$ changes from $2$ to $8$
- For $x = 2 \rightarrow 3$, $y$ changes from $8$ to $14$
- For $x = 3 \rightarrow 4$, $y$ changes from $14$ to $20$
- Calculate each rate of change
The rate of change (slope) can be found using the formula:
$$ \text{Rate of Change} = \frac{\Delta y}{\Delta x} $$
where $\Delta y = y_{new} - y_{old}$ and $\Delta x = x_{new} - x_{old}$.
- Plug values into the formula
-
From $0$ to $1$: $$ \text{Rate}_1 = \frac{2 - (-4)}{1 - 0} = \frac{6}{1} = 6 $$
-
From $1$ to $2$: $$ \text{Rate}_2 = \frac{8 - 2}{2 - 1} = \frac{6}{1} = 6 $$
-
From $2$ to $3$: $$ \text{Rate}_3 = \frac{14 - 8}{3 - 2} = \frac{6}{1} = 6 $$
-
From $3$ to $4$: $$ \text{Rate}_4 = \frac{20 - 14}{4 - 3} = \frac{6}{1} = 6 $$
- Determine the overall rate of change
Since the rates of change between each interval are consistent, the overall rate of change for the table is:
$$ \text{Overall Rate of Change} = 6 $$
The rate of change of the table is $6$.
More Information
The rate of change represents how much $y$ increases for each unit increase in $x$. In this case, for every increase of 1 in $x$, $y$ consistently increases by 6.
Tips
- Forgetting to calculate changes between the correct pairs of $x$ and $y$ values.
- Confusing the order of values when calculating the rates of change.
- Assuming the rate of change is constant without checking all intervals.
AI-generated content may contain errors. Please verify critical information