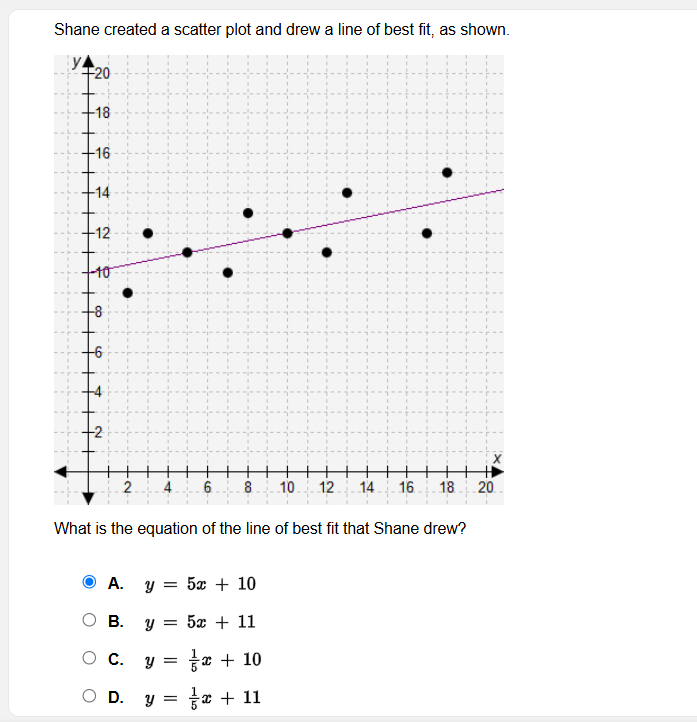
What is the equation of the line of best fit that Shane drew?

Understand the Problem
The question is asking to determine the equation of the line of best fit based on the information provided from the scatter plot drawn by Shane.
Answer
The equation is $$ y = \frac{1}{2}x + 10 $$.
Answer for screen readers
The equation of the line of best fit is $$ y = \frac{1}{2}x + 10 $$.
Steps to Solve
-
Identify key points on the line Locate two clear points on the line of best fit. For example, one point is at (0, 10) and another at (4, 12).
-
Calculate the slope (m) Use the slope formula, which is given by $$ m = \frac{y_2 - y_1}{x_2 - x_1} $$. Here, using our points:
- Point 1: (0, 10)
- Point 2: (4, 12)
The slope calculation will be: $$ m = \frac{12 - 10}{4 - 0} = \frac{2}{4} = \frac{1}{2} $$
-
Determine the y-intercept (b) Since one of the points is (0, 10), the y-intercept is 10. This can be written as: $$ b = 10 $$
-
Write the equation of the line Using the slope-intercept form $$ y = mx + b $$, where $m = \frac{1}{2}$ and $b = 10$, the equation is: $$ y = \frac{1}{2}x + 10 $$
The equation of the line of best fit is $$ y = \frac{1}{2}x + 10 $$.
More Information
This equation indicates that for every increase of 1 in $x$, $y$ increases by $\frac{1}{2}$. This line summarizes the overall trend of the data points shown in the scatter plot.
Tips
- Confusing the slope and y-intercept. Ensure that the calculated slope is used correctly with the y-intercept.
- Misidentifying the points on the line of best fit. Always pick points that are clearly on the line.
AI-generated content may contain errors. Please verify critical information