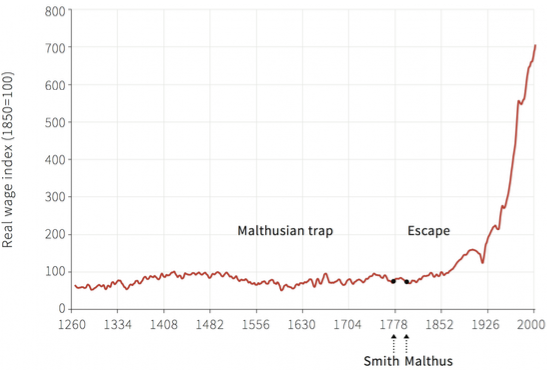
What does the graph of the real wage index from 1260 to 2000 indicate about the Malthusian trap and the escape from it?

Understand the Problem
The question is likely asking about the implications of the graph showing the real wage index over time, particularly in relation to events like the Malthusian trap and the works of Smith and Malthus.
Answer
Stagnant wages indicate the Malthusian trap, followed by a rise post-1800 showing escape.
The graph shows a long period of stagnant real wage growth, indicating the Malthusian trap, followed by a dramatic rise after 1800, showing escape due to industrialization.
Answer for screen readers
The graph shows a long period of stagnant real wage growth, indicating the Malthusian trap, followed by a dramatic rise after 1800, showing escape due to industrialization.
More Information
The Malthusian trap refers to a situation where population growth outpaces agricultural production, leading to periodic famine and stagnant living standards. The Industrial Revolution enabled economies to escape this trap through technological advancements, drastically improving productivity and wages.
Tips
Confusing short-term fluctuations in wages before 1800 as evidence of escape can be misleading; the significant and sustained rise occurred after industrial advancements.
Sources
- 2. Technology, population, and growth – The Economy 1.0 - core-econ.org
- Breaking out of the Malthusian trap: How pandemics allow us to ... - ourworldindata.org
AI-generated content may contain errors. Please verify critical information