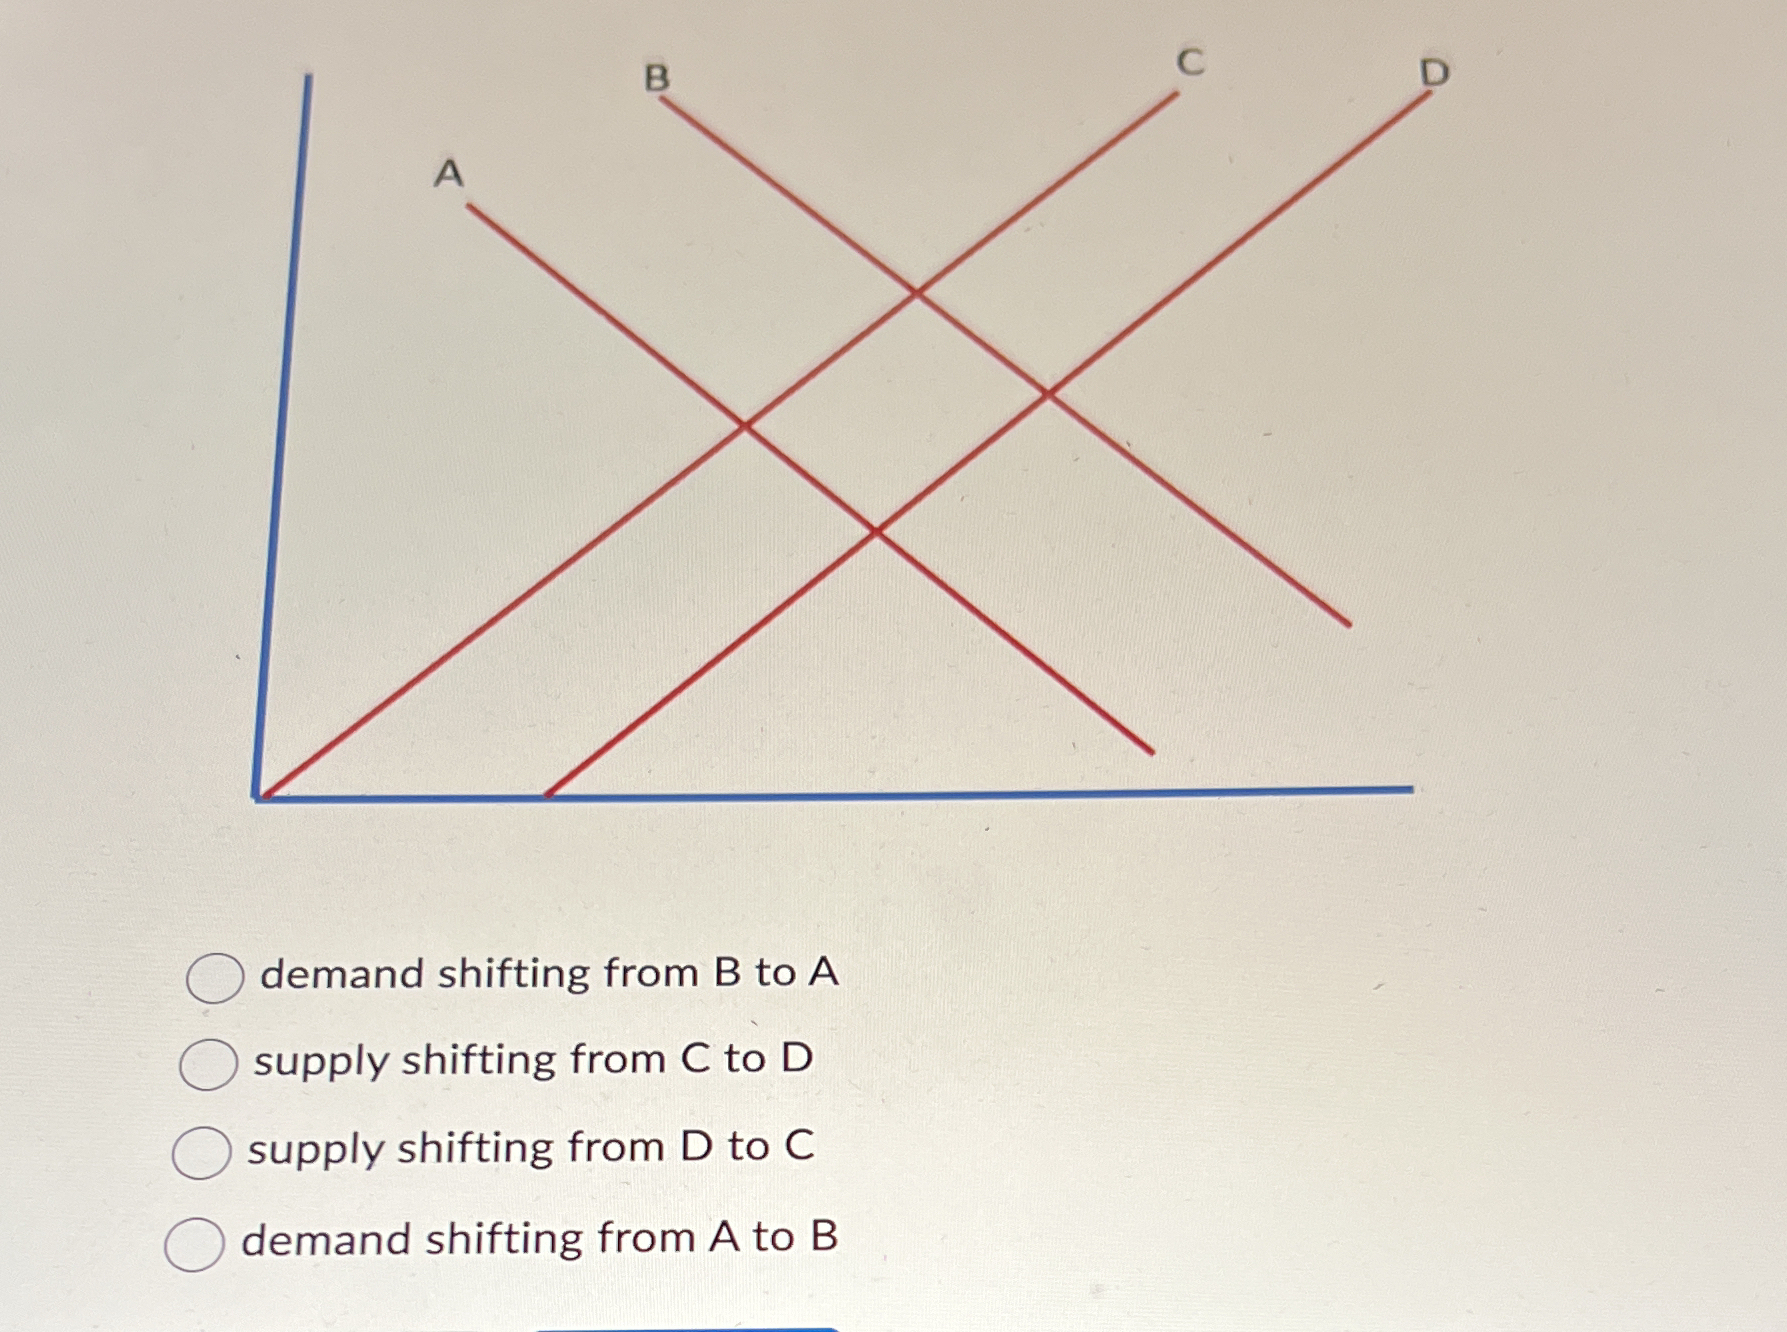
What does the graph indicate about demand and supply shifts between points A, B, C, and D?

Understand the Problem
The question involves analyzing a graphical representation of supply and demand curves in order to determine which option correctly describes the shifting of supply or demand based on the provided intersections. The goal is to determine how these shifts impact the market equilibrium for the variables labeled A, B, C, and D.
Answer
Supply shifting from D to C.
The correct answer is 'supply shifting from D to C.'
Answer for screen readers
The correct answer is 'supply shifting from D to C.'
More Information
The graph shows the supply curve shifting inward (decrease) from the initial position at point D to the new position at point C.
Tips
A common mistake is confusing shifts in the supply or demand curve with movements along the curve due to price changes.
Sources
- 3.3 Demand, Supply, and Equilibrium – Principles of Economics - open.lib.umn.edu
- Changes in Supply and Demand | Microeconomics - Lumen Learning - courses.lumenlearning.com
- Supply & Demand | Graphs, Interpretation & Examples - Lesson - study.com
AI-generated content may contain errors. Please verify critical information