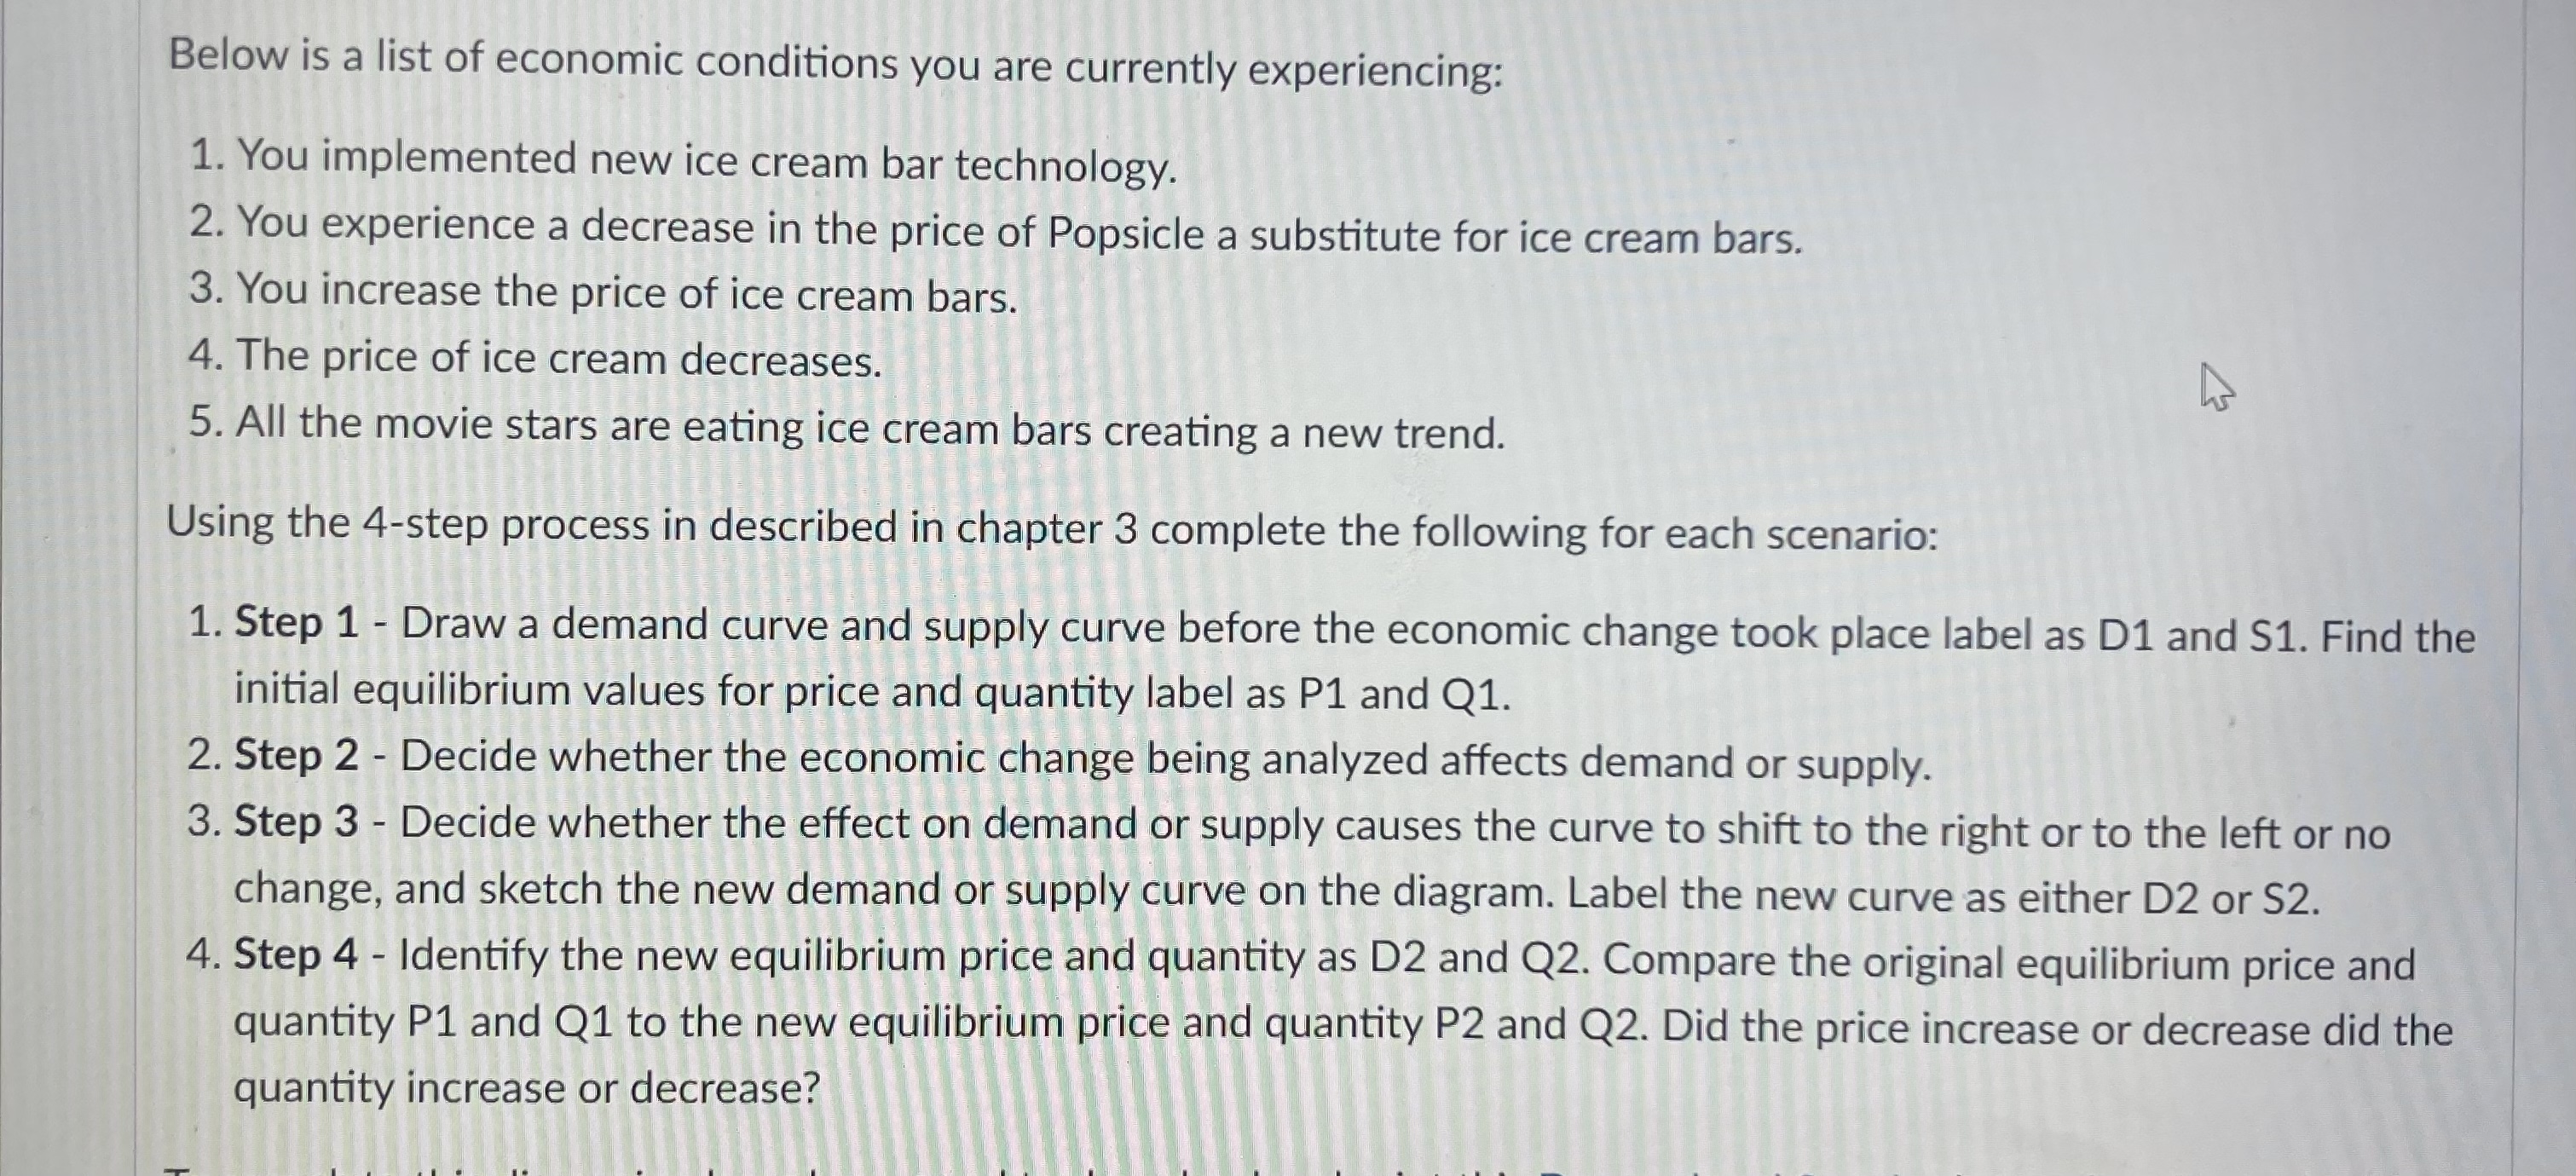
Using the 4-step process in described in chapter 3, complete the following for each scenario regarding ice cream bars: 1. Draw a demand and supply curve before the economic changes... Using the 4-step process in described in chapter 3, complete the following for each scenario regarding ice cream bars: 1. Draw a demand and supply curve before the economic changes with labels as D1 and S1 for price and quantity labels as P1 and Q1. 2. Decide whether the economic change being analyzed affects demand or supply. 3. Sketch the new demand or supply curve and label it as D2 or S2. 4. Identify the new equilibrium price and quantity as D2 and Q2. Compare the original equilibrium price and quantity P1 and Q1 to the new equilibrium price and quantity P2 and Q2. Did the price increase or decrease?

Understand the Problem
The question is asking how to analyze changes in demand and supply for ice cream bars based on various economic conditions outlined. It requires following a structured 4-step process to draw diagrams and interpret the effects on price and quantity.
Answer
Various shifts: new tech right (S), Popsicle left (D), price increase left (D), price decrease right (D), celebrities right (D).
For each scenario:
- New technology increases supply: Shift S1 right to S2, lower P2, higher Q2.
- Decrease in Popsicle price decreases demand: Shift D1 left to D2, lower P2, lower Q2.
- Increase ice cream price decreases demand: Shift D1 left to D2, lower P2, lower Q2.
- Price decrease increases demand: Shift D1 right to D2, higher P2, higher Q2.
- Celebrity trend increases demand: Shift D1 right to D2, higher P2, higher Q2.
Answer for screen readers
For each scenario:
- New technology increases supply: Shift S1 right to S2, lower P2, higher Q2.
- Decrease in Popsicle price decreases demand: Shift D1 left to D2, lower P2, lower Q2.
- Increase ice cream price decreases demand: Shift D1 left to D2, lower P2, lower Q2.
- Price decrease increases demand: Shift D1 right to D2, higher P2, higher Q2.
- Celebrity trend increases demand: Shift D1 right to D2, higher P2, higher Q2.
More Information
Economic changes influence the supply or demand curves, leading to a new equilibrium in the market. This demonstrates responsiveness of markets to changes in technology, preferences, and prices.
Tips
A common mistake is shifting both curves when only one is affected. Ensure only one curve shifts, and the new intersection determines the new equilibrium.
Sources
AI-generated content may contain errors. Please verify critical information