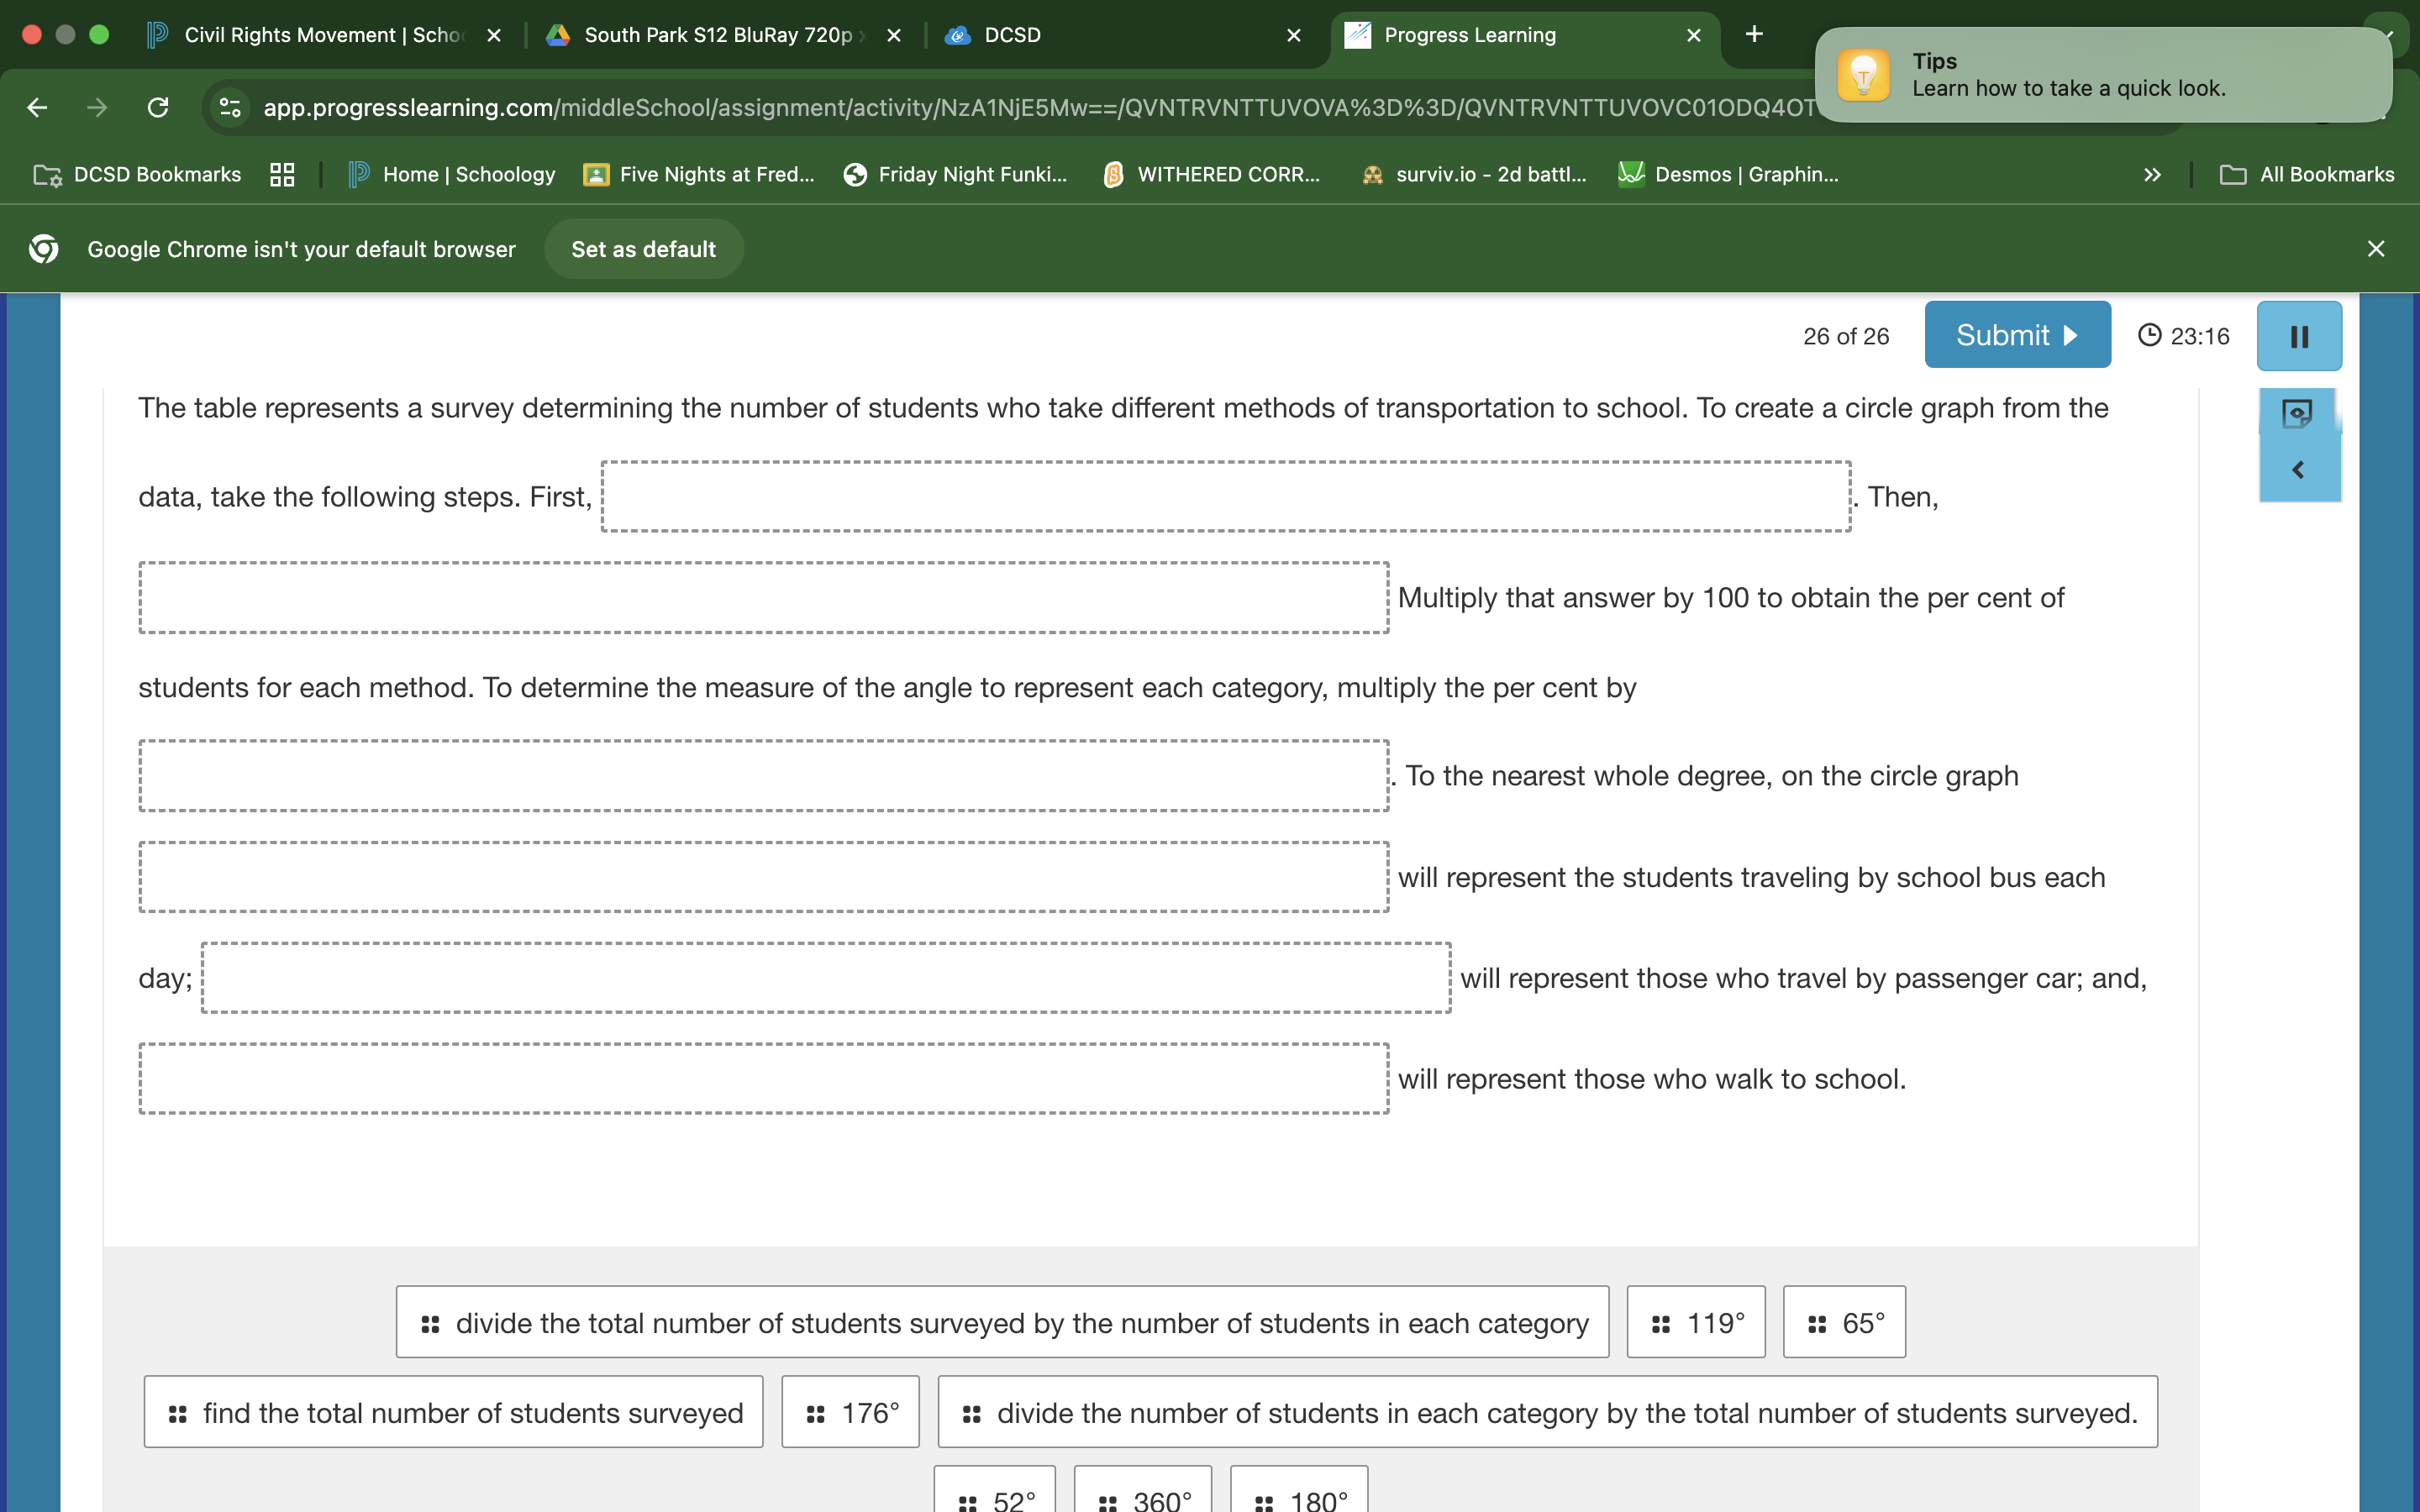
The table represents a survey determining the number of students who take different methods of transportation to school. To create a circle graph from the data, take the following... The table represents a survey determining the number of students who take different methods of transportation to school. To create a circle graph from the data, take the following steps. First, _____. Then, _____. Multiply that answer by 100 to obtain the percent of students for each method. To determine the measure of the angle to represent each category, multiply the percent by _____. To the nearest whole degree, on the circle graph ____ will represent the students traveling by school bus each day; _____ will represent those who travel by passenger car; and, _____ will represent those who walk to school.
Understand the Problem
The question is asking to fill in the blanks in order to explain the process of creating a circle graph from the data collected in a survey. This involves finding the total number of students surveyed, calculating the percentage of students for each transportation method, and determining the angle measure for each category to accurately represent the data in the circle graph.
Answer
First, find the total number of students surveyed. Then, divide the number of students in each category by the total number of students surveyed. Multiply that answer by 100 to obtain the per cent of students for each method. To determine the measure of the angle to represent each category, multiply the per cent by $360^\circ$. To the nearest whole degree, on the circle graph $133^\circ$ will represent the students traveling by school bus each day; $106^\circ$ will represent those who travel by passenger car; and, $121^\circ$ will represent those who walk to school.
Answer for screen readers
First, find the total number of students surveyed. Then, divide the number of students in each category by the total number of students surveyed. Multiply that answer by 100 to obtain the per cent of students for each method. To determine the measure of the angle to represent each category, multiply the per cent by 360$^\circ$. To the nearest whole degree, on the circle graph 133$^\circ$ will represent the students traveling by school bus each day; 106$^\circ$ will represent those who travel by passenger car; and, 121$^\circ$ will represent those who walk to school.
Steps to Solve
- Find the total number of students surveyed
To start creating a circle graph, we need to know the total number of students who participated in the survey. This will be the denominator when calculating the proportion of students for each transportation method.
- Divide the number of students in each category by the total number of students surveyed
Next, for each transportation method, divide the number of students using that method by the total number of students surveyed. This gives the proportion of students for each category.
- Multiply the percentage by 360
Since a circle has 360 degrees, multiplying the percentage for each category by 360 will give the angle measure needed to represent that category in the circle graph.
- Calculate the angle measure for each method
Assuming we have the number of students for each method as follows: School Bus (65), passenger car (52) and Walk (59) the total is 176.
- School Bus
Angle $= \frac{65}{176} \times 360 \approx 133^\circ $.
-
Passenger Car Angle $= \frac{52}{176} \times 360 \approx 106^\circ $.
-
Walk Angle $= \frac{59}{176} \times 360 \approx 121^\circ $.
First, find the total number of students surveyed. Then, divide the number of students in each category by the total number of students surveyed. Multiply that answer by 100 to obtain the per cent of students for each method. To determine the measure of the angle to represent each category, multiply the per cent by 360$^\circ$. To the nearest whole degree, on the circle graph 133$^\circ$ will represent the students traveling by school bus each day; 106$^\circ$ will represent those who travel by passenger car; and, 121$^\circ$ will represent those who walk to school.
More Information
A circle graph, also known as a pie chart, is a circular statistical graphic, which is divided into slices to illustrate numerical proportion. In a circle graph, the arc length of each slice (and consequently its central angle and area), is proportional to the quantity it represents. Together, the slices create a full disk.
Tips
A common mistake is forgetting to multiply by 100 to convert the proportion to a percentage. Another mistake is not multiplying by 360 to find the angle measures for the circle graph. Also, students might incorrectly calculate the total number of students surveyed, leading to incorrect proportions and angle measures.
AI-generated content may contain errors. Please verify critical information