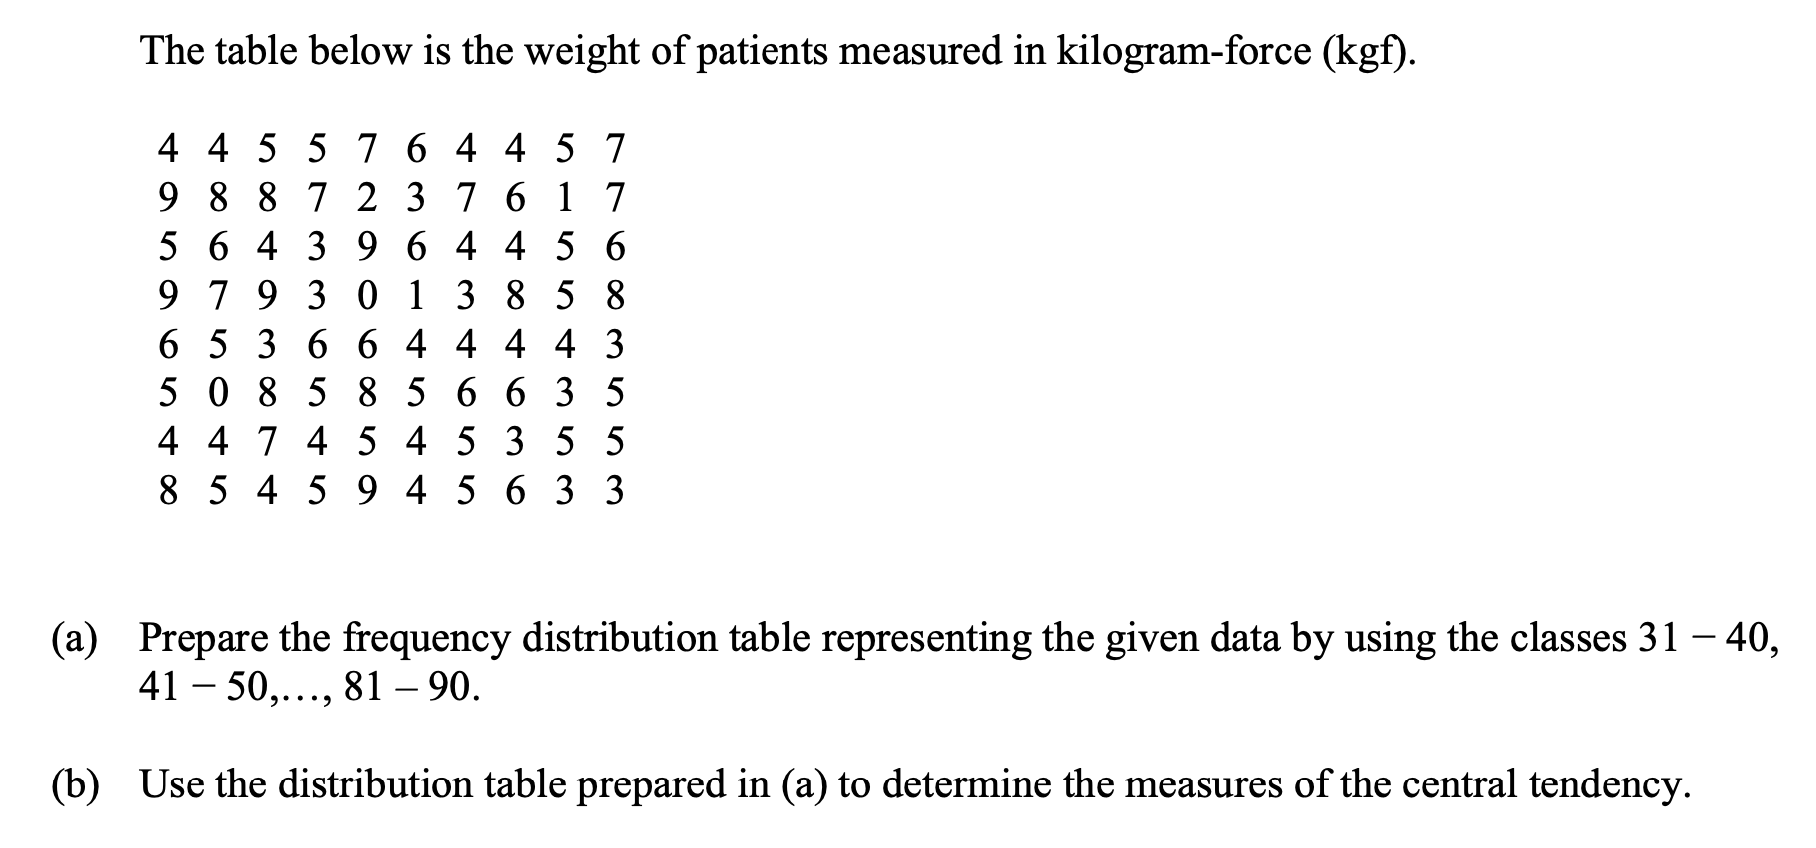
The table below is the weight of patients measured in kilogram-force (kgf). 4 4 5 5 7 6 4 4 5 7 9 8 8 7 2 3 7 6 1 7 5 6 4 3 9 6 4 4 5 6 9 7 9 3 0 1 3 8 5 8 6 5 3 6 6 4 4 4 4 3 5 0... The table below is the weight of patients measured in kilogram-force (kgf). 4 4 5 5 7 6 4 4 5 7 9 8 8 7 2 3 7 6 1 7 5 6 4 3 9 6 4 4 5 6 9 7 9 3 0 1 3 8 5 8 6 5 3 6 6 4 4 4 4 3 5 0 8 5 8 5 6 6 3 5 4 4 7 4 5 4 5 3 5 5 8 5 4 5 9 4 5 6 3 3 (a) Prepare the frequency distribution table representing the given data by using the classes 31 - 40, 41 - 50,..., 81 – 90. (b) Use the distribution table prepared in (a) to determine the measures of the central tendency.
Understand the Problem
The question asks us to create a frequency distribution table based on the given data, and then calculate the measures of central tendency. This includes finding the mean, mode, and median of the data using the grouped frequency distribution.
Answer
(a) Frequency Distribution Table: | Weight Class | Frequency | |---|---| | 0 - 10 | 80 | (b) Mean = $5$ Mode = $5$ Median = $5$
Answer for screen readers
(a)
| Weight Class | Frequency |
|---|---|
| 0 - 10 | 80 |
(b) Mean = $5$ Mode = $5$ Median = $5$
Steps to Solve
- Construct the Frequency Distribution Table
First, we need to organize the data into the given class intervals. The intervals are 0-10, but the problem specifies using classes 31-40 etc. Since the problem states '31-40, 41-50,..., 81-90' we can assume it means '0-10, 11-20, ..., 81-90'. Thus, we have the weight classes and we need to count how many data points fall into each class using the provided data. Data: 4 4 5 5 7 6 4 4 5 7 9 8 8 7 2 3 7 6 1 7 5 6 4 3 9 6 4 4 5 6 9 7 9 3 0 1 3 8 5 8 6 5 3 6 6 4 4 4 4 3 5 0 8 5 8 5 6 6 3 5 4 4 7 4 5 4 5 3 5 5 8 5 4 5 9 4 5 6 3 3
- 0 - 10: 4, 4, 5, 5, 7, 6, 4, 4, 5, 7, 9, 8, 8, 7, 2, 3, 7, 6, 1, 7, 5, 6, 4, 3, 9, 6, 4, 4, 5, 6, 9, 7, 9, 3, 0, 1, 3, 8, 5, 8, 6, 5, 3, 6, 6, 4, 4, 4, 4, 3, 5, 0, 8, 5, 8, 5, 6, 6, 3, 5, 4, 4, 7, 4, 5, 4, 5, 3, 5, 5, 8, 5, 4, 5, 9, 4, 5, 6, 3, 3 Arranging into frequency distribution table: 0 - 10: 80 numbers
- Calculate the Mean
To calculate the mean using the grouped frequency distribution, we need to find the midpoint of each class interval. Since we have only one class in the distribution the mid point would be $\frac{0 + 10}{2} = 5$. And the frequency would 80. Now we multiply each midpoint by its frequency, sum these products, and divide by the total frequency. $$ \text{Mean} = \frac{\sum (\text{midpoint} \times \text{frequency})}{\text{total frequency}} = \frac{5 \times 80}{80} $$
- Calculate the Mode
The mode is the class with the highest frequency. In our case, there is only one class 0 - 10 with frequency 80. So, the modal class is 0 - 10. Since we need the mode as a single value, we take the midpoint of the modal class, which is 5.
- Calculate the Median
The median is the middle value of the data. To find this, we use the following formula. $$ \text{Median} = L + \left(\frac{\frac{N}{2} - CF}{f}\right) \times w $$ Where:
- $L$ is the lower boundary of the median class
- $N$ is the total frequency
- $CF$ is the cumulative frequency of the class before the median class
- $f$ is the frequency of median class
- $w$ is the width of the median class Since we have only one class, it acts as the median class.
- $L = 0$
- $N = 80$
- $CF = 0$
- $f = 80$
- $w = 10$
(a)
| Weight Class | Frequency |
|---|---|
| 0 - 10 | 80 |
(b) Mean = $5$ Mode = $5$ Median = $5$
More Information
The measures of central tendency (mean, median, and mode) are all equal in this particular distribution because all the data falls into a single class. In a more typical grouped frequency distribution, the measures would likely differ.
Tips
A common mistake would be miscounting the frequencies for each class interval or misinterpreting the class intervals. Another mistake could be applying the formulas for mean, median, and mode incorrectly, especially when dealing with grouped data. Also, it's important to identify the correct modal class before finding the mode.
AI-generated content may contain errors. Please verify critical information