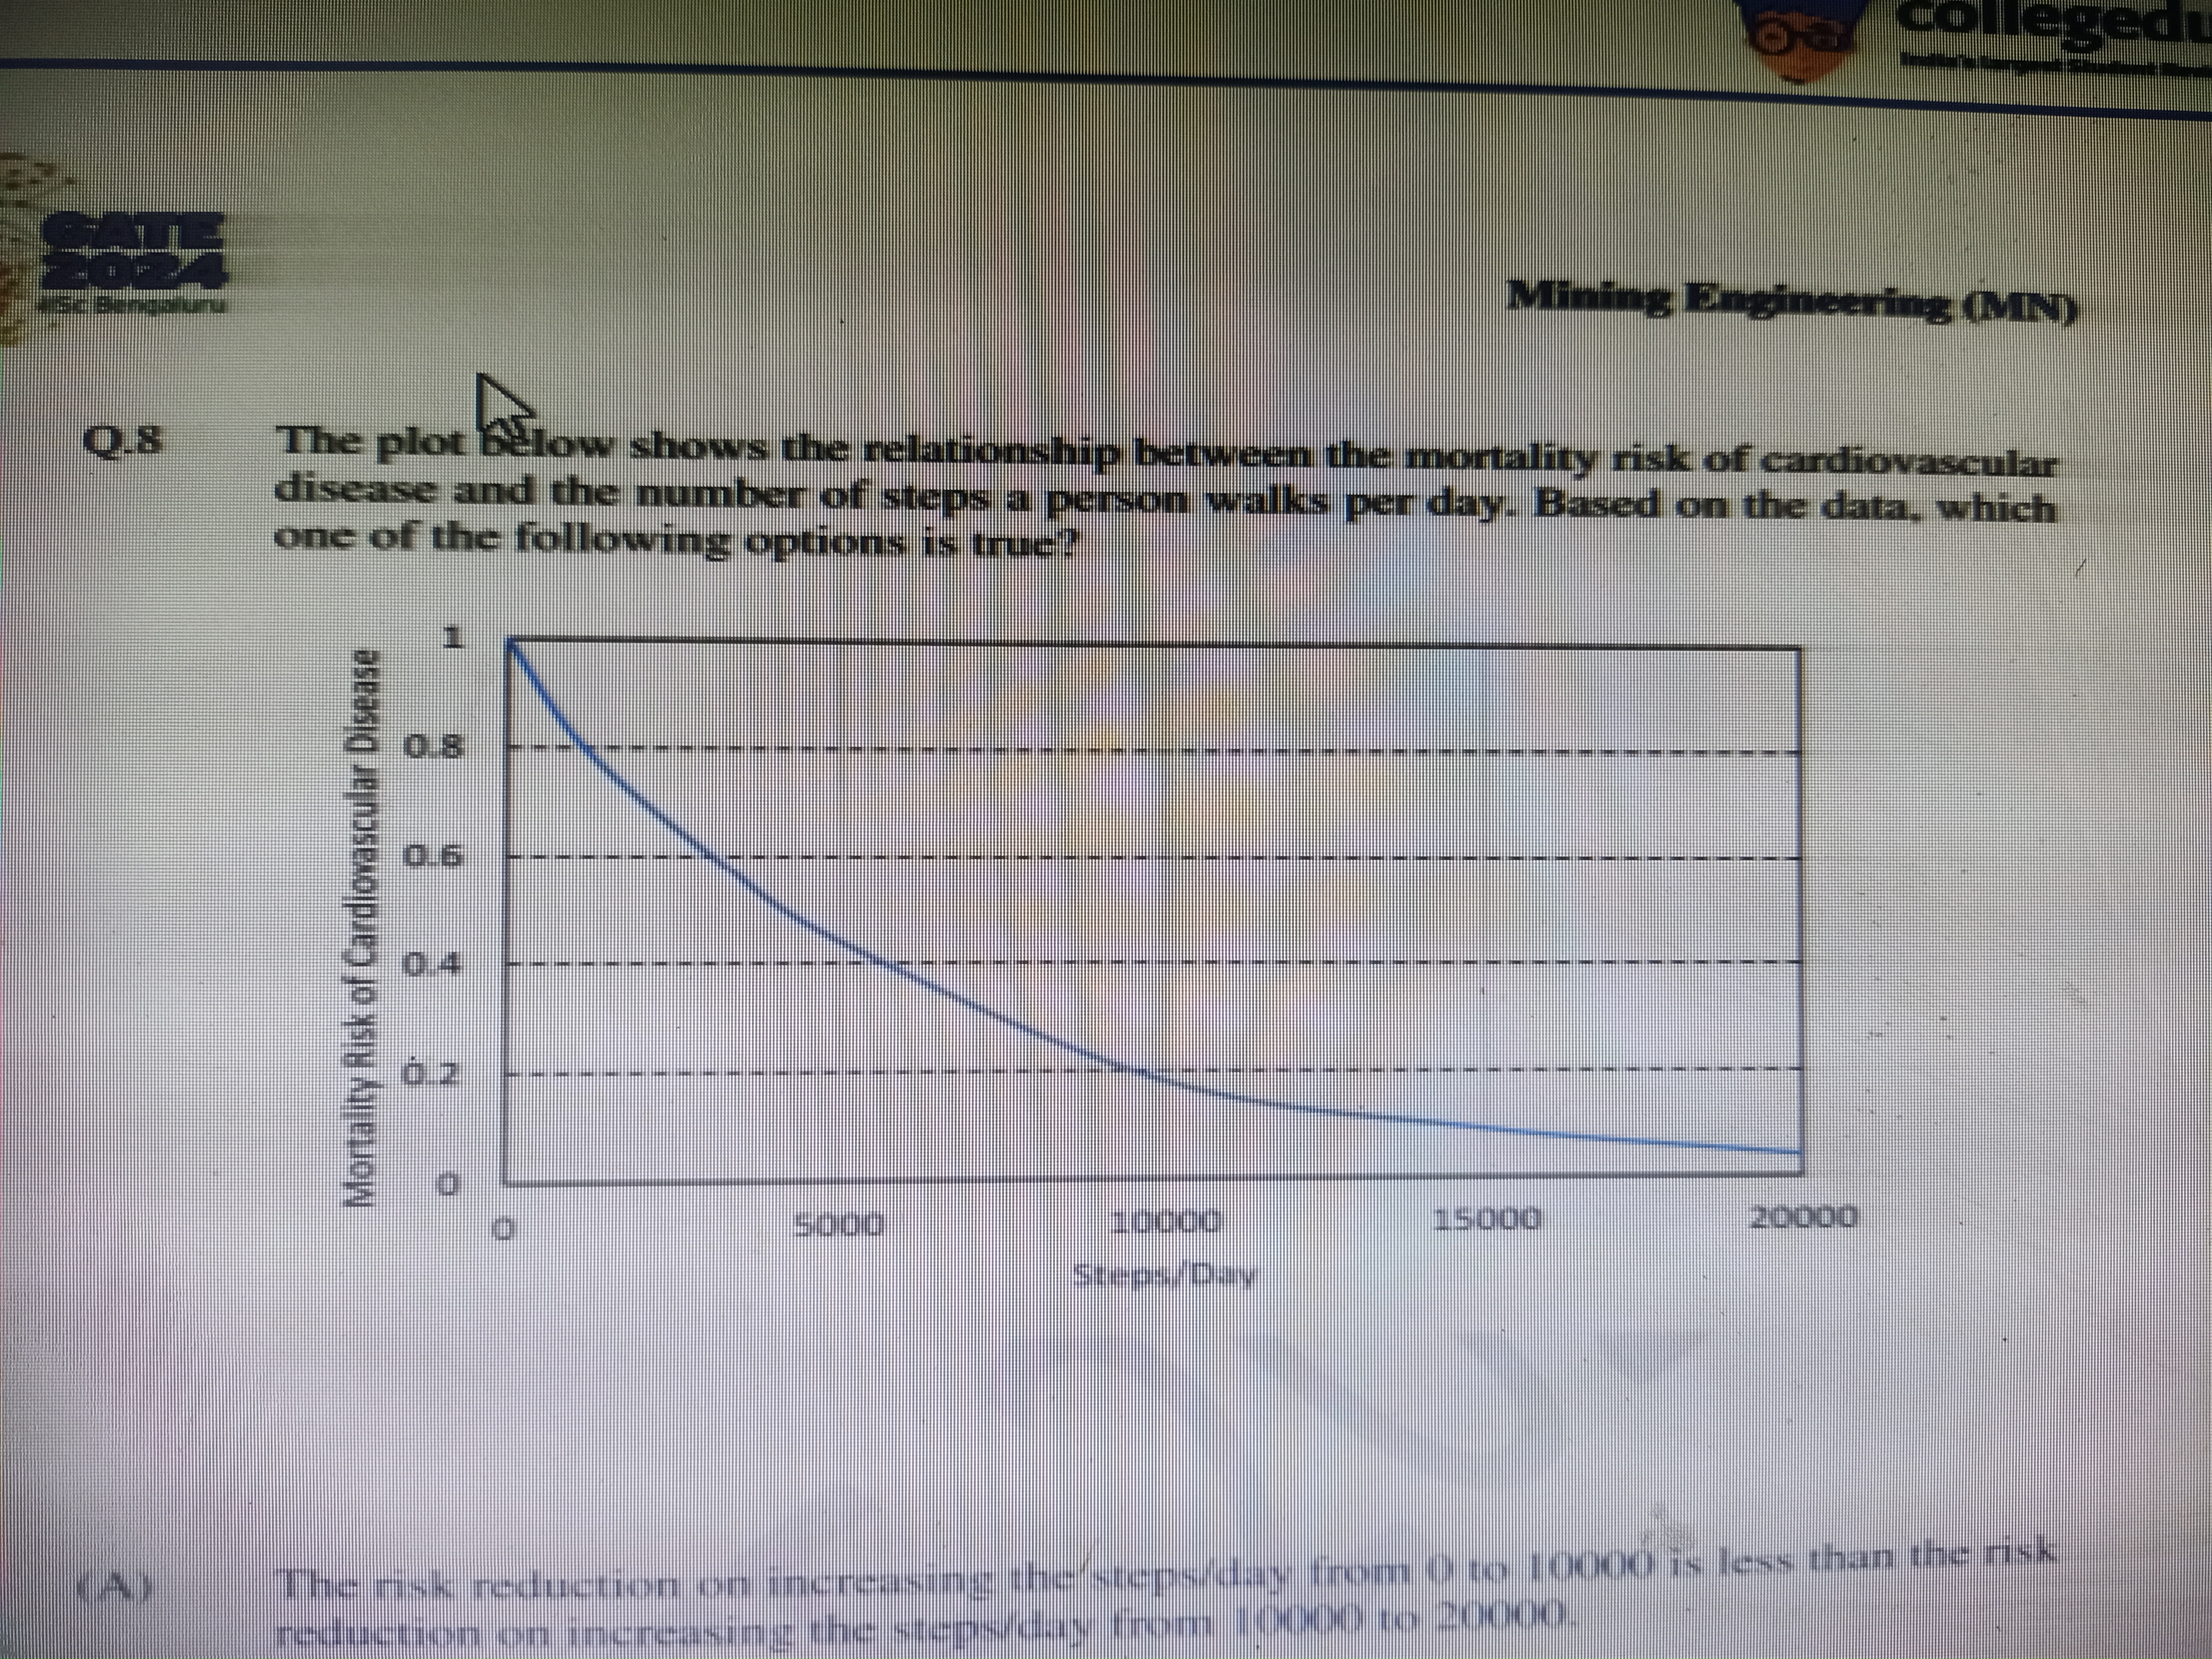
The plot below shows the relationship between the mortality risk of cardiovascular disease and the number of steps a person walks per day. Based on the data, which one of the follo... The plot below shows the relationship between the mortality risk of cardiovascular disease and the number of steps a person walks per day. Based on the data, which one of the following options is true?

Understand the Problem
The question is asking about the relationship between the number of steps taken per day and the mortality risk of cardiovascular disease as shown in a plotted graph. It specifically seeks to determine the validity of a statement regarding the risk reduction associated with different ranges of steps taken.
Answer
The statement is false; the risk reduction from $0$ to $10,000$ steps is greater than from $10,000$ to $20,000$.
Answer for screen readers
The option (A) is false; the risk reduction from increasing steps/day from 0 to 10,000 is greater than the risk reduction from increasing the steps from 10,000 to 20,000.
Steps to Solve
-
Analyze the Graph The graph illustrates the relationship between daily steps and mortality risk for cardiovascular disease. As the number of steps increases from 0 to 20,000, the mortality risk decreases.
-
Determine Risk Reduction Segments Examine the segments of the graph for specific ranges of steps:
- From 0 to 10,000 steps: Observe the initial steep decline in mortality risk.
- From 10,000 to 20,000 steps: Note that the decline in mortality risk becomes less steep.
-
Evaluate Statement Validity The provided option claims that the risk reduction from 0 to 10,000 steps is less than from 1,000 to 20,000:
- Consider the steep decline in the first segment vs. the gradual decline in the second segment.
- Based on the graph's behavior, the risk reduction from 0 to 10,000 steps is more significant.
-
Conclude on the Statement Summarize findings:
- The statement is false because the initial increase in activity shows a more substantial risk reduction compared to the later range.
The option (A) is false; the risk reduction from increasing steps/day from 0 to 10,000 is greater than the risk reduction from increasing the steps from 10,000 to 20,000.
More Information
In many studies, increases in physical activity, especially in lower ranges, tend to yield more substantial benefits in reducing health risks compared to higher levels of activity. This reflects how initial lifestyle changes can lead to significant health improvements.
Tips
- Misinterpreting the steepness of the graph might lead one to believe that the risk reduction is constant across all ranges.
- Failing to analyze the differences in risk reduction across segments can result in incorrect conclusions.
AI-generated content may contain errors. Please verify critical information