The owner of a new restaurant is ordering tables and chairs. She wants to have only tables for 2 and tables for 4. The total number of people that can be seated in the restaurant i... The owner of a new restaurant is ordering tables and chairs. She wants to have only tables for 2 and tables for 4. The total number of people that can be seated in the restaurant is 120. What are the x - and y-intercepts of the line? What do they represent in the situation?
Understand the Problem
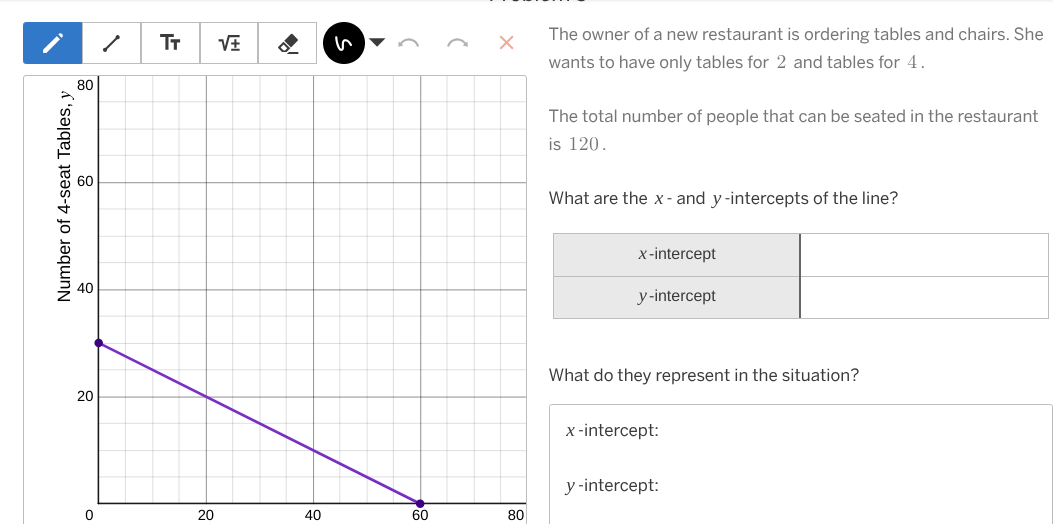
The question describes a scenario where a restaurant owner is ordering 2-seat and 4-seat tables. The total seating capacity is 120. A graph is provided representing a linear relationship, where the y-axis represents the number of 4-seat tables. The question asks to identify the x and y intercepts of the line and to explain what each intercept mean in the context of this problem.
Answer
x-intercept: 60 y-intercept: 30 x-intercept: 60 tables with 2 seats y-intercept: 30 tables with 4 seats
Answer for screen readers
x-intercept: 60 y-intercept: 30
x-intercept: If the restaurant only has 2-seat tables, they can have 60 tables. y-intercept: If the restaurant only has 4-seat tables, they can have 30 tables.
Steps to Solve
- Identify the x-intercept from the graph
The x-intercept is the point where the line crosses the x-axis (where $y = 0$). From the graph, the line crosses the x-axis at $x = 60$.
- Interpret the x-intercept in context
The x-intercept represents the scenario where the restaurant only has 2-seat tables and no 4-seat tables. In this case, the restaurant would have 60 tables that seat 2 people each, for a total seating capacity of $60 \times 2 = 120$ people.
- Identify the y-intercept from the graph
The y-intercept is the point where the line crosses the y-axis (where $x = 0$). From the graph, the line crosses the y-axis at $y = 30$.
- Interpret the y-intercept in context
The y-intercept represents the scenario where the restaurant only has 4-seat tables and no 2-seat tables. In this case, the restaurant would have 30 tables that seat 4 people each, for a total seating capacity of $30 \times 4 = 120$ people.
x-intercept: 60 y-intercept: 30
x-intercept: If the restaurant only has 2-seat tables, they can have 60 tables. y-intercept: If the restaurant only has 4-seat tables, they can have 30 tables.
More Information
The equation represented by the graph is: $2x + 4y = 120$ Where $x$ is the number of 2-seat tables and $y$ is the number of 4-seat tables.
Tips
A common mistake is to misread the graph, especially if the scale is not clear. Also, confusing the x and y intercepts. Another is not understanding the context of what the intercepts represent.
AI-generated content may contain errors. Please verify critical information