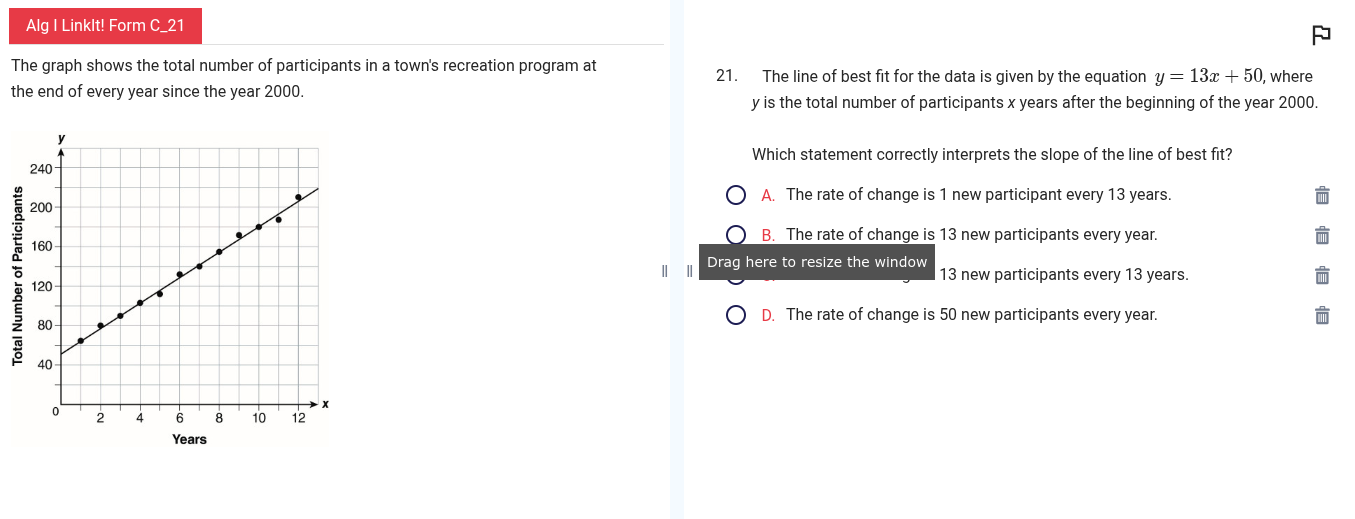
The line of best fit for the data is given by the equation y = 13x + 50, where y is the total number of participants x years after the beginning of the year 2000. Which statement c... The line of best fit for the data is given by the equation y = 13x + 50, where y is the total number of participants x years after the beginning of the year 2000. Which statement correctly interprets the slope of the line of best fit?
Understand the Problem
The question asks to interpret the slope of a given linear equation in the context of a word problem. The equation represents the total number of participants in terms of years, so the slope represents the rate of change of participants per year.
Answer
B. The rate of change is 13 new participants every year.
Answer for screen readers
B. The rate of change is 13 new participants every year.
Steps to Solve
- Identify the slope in the equation
The equation of the line of best fit is given as $y = 13x + 50$. In the slope-intercept form of a linear equation, $y = mx + b$, $m$ represents the slope and $b$ represents the y-intercept. In this case, $m = 13$ and $b = 50$.
- Interpret the slope in the context of the problem
The slope, 13, represents the rate of change of the total number of participants ($y$) with respect to the number of years after 2000 ($x$). Since $y$ represents the total number of participants and $x$ represents the number of years, the slope represents the number of additional participants per year. Therefore, for every year that passes, the number of participants increases by 13.
- Match the interpretation with the correct statement
We need to find the statement that correctly says that the number of participants increases by 13 every year.
B. The rate of change is 13 new participants every year.
More Information
The slope of a linear equation describes the rate of change of the dependent variable ($y$) with respect to the independent variable ($x$). In this context, it tells us how many new participants join the recreation program each year. The y-intercept (50) tells us the number of participants at the beginning of the year 2000.
Tips
A common mistake is to confuse the slope with the y-intercept or to misinterpret the units of the slope (participants per year). Another common mistake is to calculate the slope incorrectly or to choose an answer that swaps the x and y values.
AI-generated content may contain errors. Please verify critical information