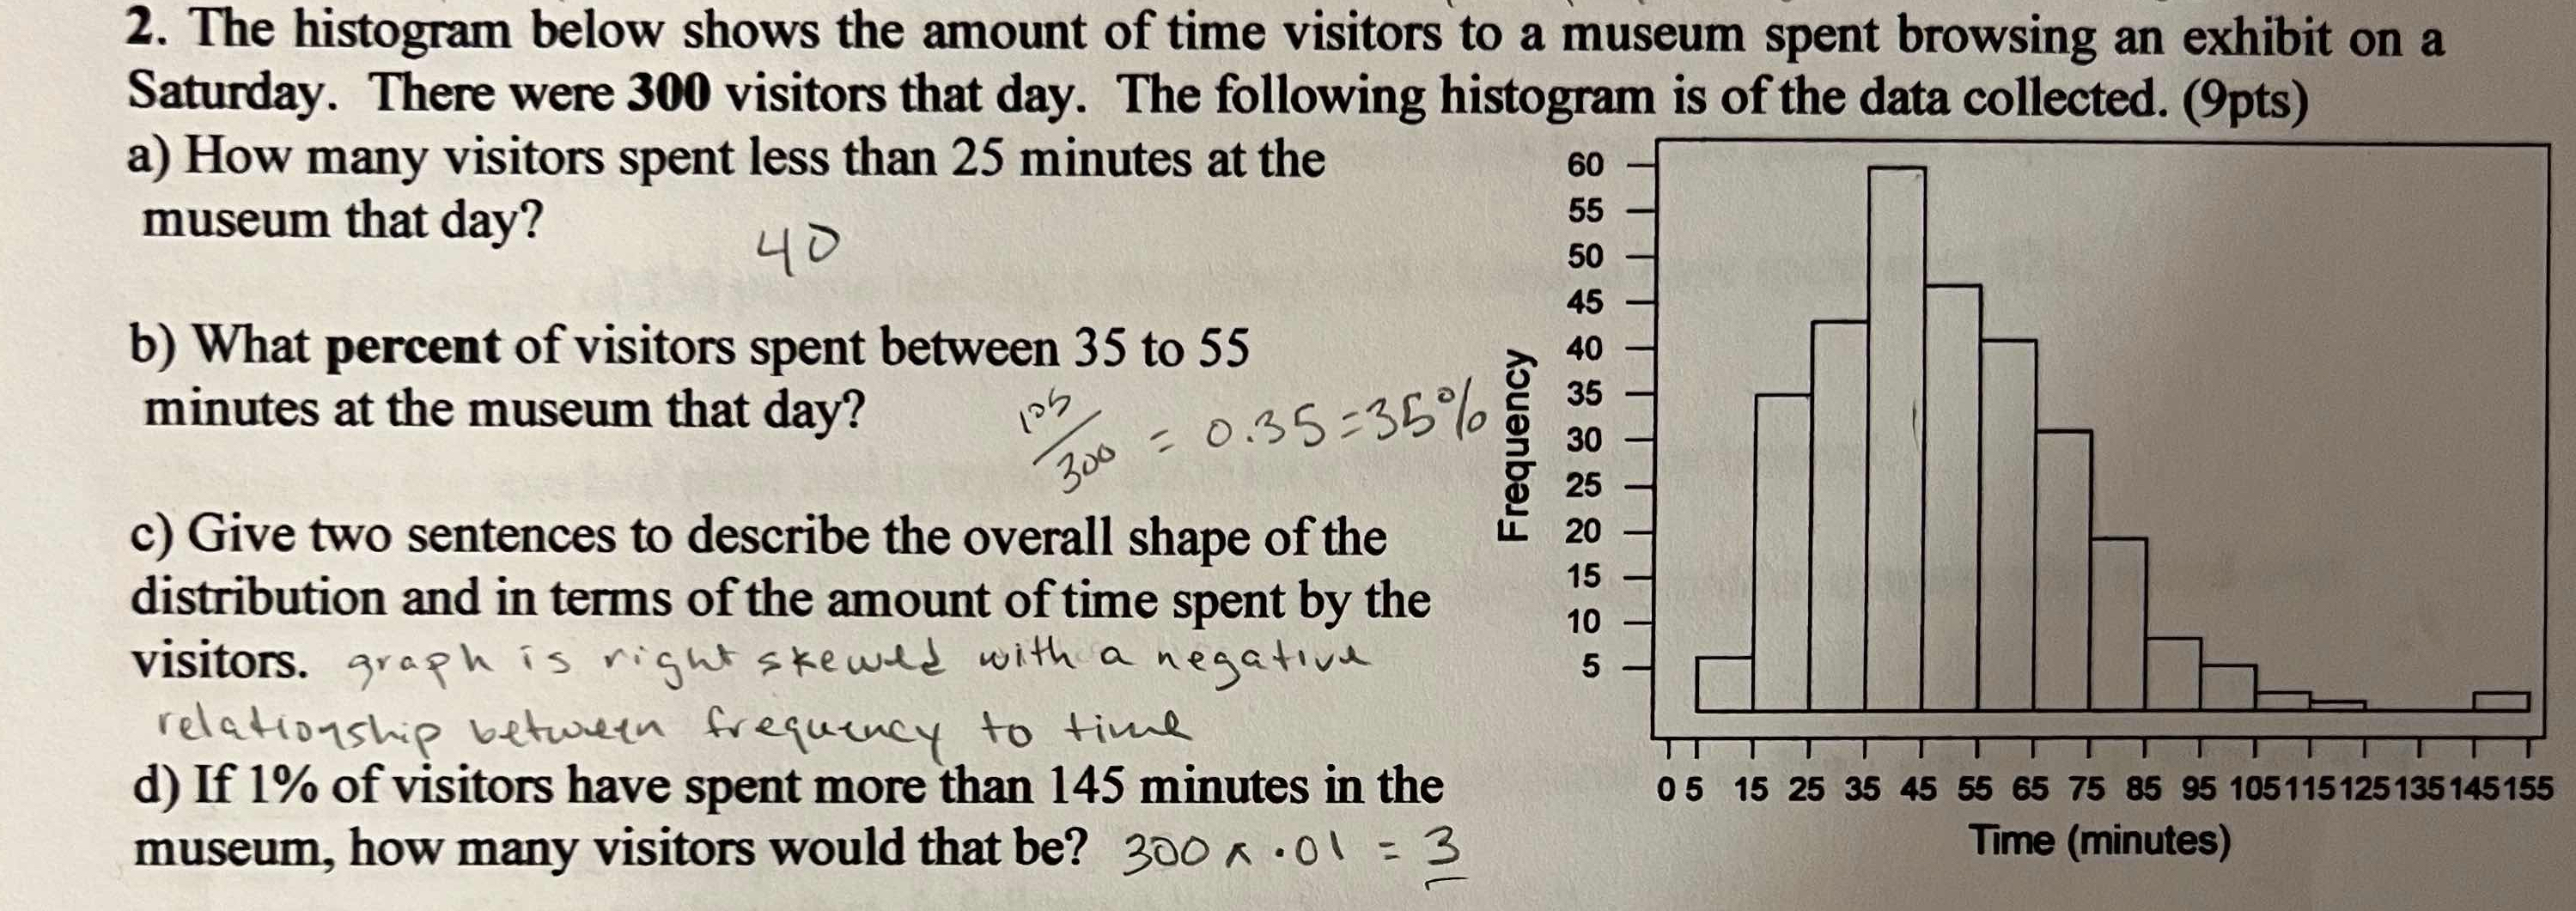
The histogram below shows the amount of time visitors spent at a museum on a Saturday. There were 300 visitors that day. a) How many visitors spent less than 25 minutes at the muse... The histogram below shows the amount of time visitors spent at a museum on a Saturday. There were 300 visitors that day. a) How many visitors spent less than 25 minutes at the museum that day? b) What percent of visitors spent between 35 to 55 minutes at the museum that day? c) Give two sentences to describe the overall shape of the distribution and in terms of the amount of time spent by the visitors. d) If 1% of visitors have spent more than 145 minutes in the museum, how many visitors would that be?

Understand the Problem
The question is asking about a histogram representing visitor data for a museum on a Saturday. It requests information about the number of visitors who spent less time, the percentage of visitors who spent a specific amount of time, a description of the distribution shape, and a calculation based on a percentage of visitors who spent over a certain amount of time.
Answer
a) 40 visitors spent less than 25 minutes. b) 28.33%. c) Right-skewed distribution; more visitors spent shorter times. d) 3 visitors.
Answer for screen readers
a) 40 visitors spent less than 25 minutes.
b) Approximately 28.33% of visitors spent between 35 to 55 minutes.
c) The distribution is right-skewed with a higher concentration of visitors spending shorter amounts of time.
d) 3 visitors spent more than 145 minutes at the museum.
Steps to Solve
- Count visitors who spent less than 25 minutes
From the histogram, determine the height of the bar for the range 0 to 25 minutes. The histogram shows that 40 visitors spent less than 25 minutes.
- Calculate the percentage of visitors spending between 35 to 55 minutes
From the histogram, sum the frequencies of the bars for 35-45 minutes and 45-55 minutes. The frequencies are:
- 35-45 minutes: 35 visitors
- 45-55 minutes: 50 visitors
Total in this range = $35 + 50 = 85$ visitors.
To find the percentage of visitors: $$ \text{Percentage} = \left( \frac{85}{300} \right) \times 100 = 28.33% $$
- Describe the overall shape of the distribution
The histogram appears right-skewed, indicating that more visitors spent less time in the museum compared to those who spent longer. The majority of visitors have times concentrated on the left side, with fewer visitors on the right.
- Calculate number of visitors spending more than 145 minutes
If 1% of the visitors spent more than 145 minutes: $$ \text{Visitors} = 300 \times 0.01 = 3 $$
a) 40 visitors spent less than 25 minutes.
b) Approximately 28.33% of visitors spent between 35 to 55 minutes.
c) The distribution is right-skewed with a higher concentration of visitors spending shorter amounts of time.
d) 3 visitors spent more than 145 minutes at the museum.
More Information
The histogram visually represents how long visitors spent in the museum, showing different time intervals. Right-skewed distributions often indicate that a majority of observations (visitors' times) cluster at lower values.
Tips
- Miscounting the frequencies in the histogram.
- Forgetting to convert the fraction to a percentage by multiplying by 100.
- Not interpreting "more than" correctly, which could lead to miscalculating the number of visitors for percentage-based questions.
AI-generated content may contain errors. Please verify critical information