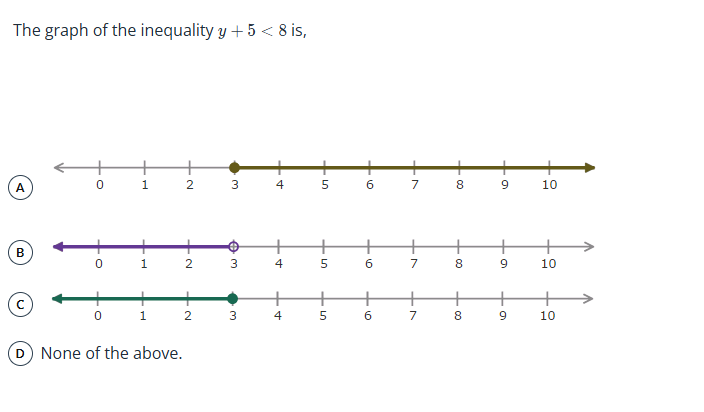
The graph of the inequality y + 5 < 8 is,
Understand the Problem
The question asks us to identify the correct graph representing the solution to the inequality y + 5 < 8. This involves solving the inequality for 'y' and then determining which of the provided number lines accurately depicts the solution set.
Answer
B
Answer for screen readers
B
Steps to Solve
- Solve the inequality for $y$
To isolate $y$, subtract 5 from both sides of the inequality: $y + 5 < 8$ $y + 5 - 5 < 8 - 5$ $y < 3$
- Interpret the solution
The solution $y < 3$ means that $y$ can be any number less than 3, but not equal to 3.
- Identify the correct graph
We need a number line that shows all values less than 3. This is represented by a line extending to the left from 3. Since $y$ cannot be equal to 3, we use an open circle at 3. Looking at the graphs, option B has an open circle at 3 and extends to the left, representing all numbers less than 3.
B
More Information
The solution to the inequality $y + 5 < 8$ is $y < 3$. This is graphically represented on a number line with an open circle at 3 and a line extending to the left, indicating all values less than 3.
Tips
A common mistake is to use a closed circle at 3, which would indicate that 3 is included in the solution set. However, since the inequality is $y < 3$ (less than, not less than or equal to), 3 is not included. Another mistake is to shade the wrong direction. Since we are looking for values less than 3, we shade to the left of 3 on the number line.
AI-generated content may contain errors. Please verify critical information