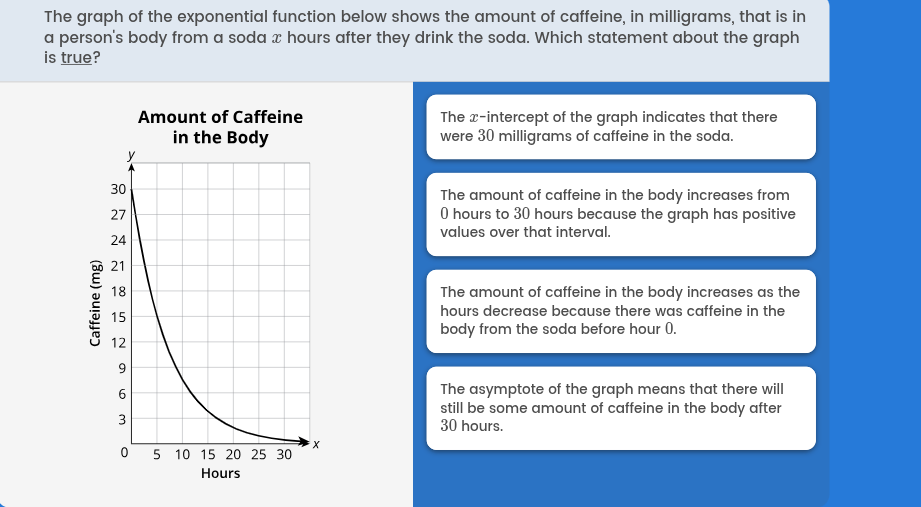
The graph of the exponential function below shows the amount of caffeine, in milligrams, that is in a person's body from a soda x hours after drinking the soda. Which statement abo... The graph of the exponential function below shows the amount of caffeine, in milligrams, that is in a person's body from a soda x hours after drinking the soda. Which statement about the graph is true?
Understand the Problem
The question presents a graph showing the amount of caffeine in a person's body over time after drinking a soda. It then asks us to identify the true statement (from the choices provided) regarding the graph's interpretation.
Answer
The asymptote of the graph means that there will still be some amount of caffeine in the body after 30 hours.
Answer for screen readers
The asymptote of the graph means that there will still be some amount of caffeine in the body after 30 hours.
Steps to Solve
- Analyze the first statement
The first statement says: "The x-intercept of the graph indicates that there were 30 milligrams of caffeine in the soda." The x-intercept is where the graph crosses the x-axis (where $y = 0$), but this graph starts at approximately $y = 30$ when $x = 0$. The y-intercept represents the initial amount of caffeine, and the x-axis represents time. Therefore, the x-intercept is not relevant for this problem, and the y-intercept is the initial amount of caffeine. This statement is incorrect.
- Analyze the second statement
The second statement says: "The amount of caffeine in the body increases from 0 hours to 30 hours because the graph has positive values over that interval." From the graph, we can see that the amount of caffeine decreases as time (hours) increases. While the graph does have positive values (meaning there is caffeine in the body), the amount is decreasing, not increasing. This statement is incorrect.
- Analyze the third statement
The third statement says: "The amount of caffeine in the body increases as the hours decrease because there was caffeine in the body from the soda before hour 0." The graph shows the amount of how much caffeine is in the body FROM the soda after drinking. The amount of caffeine cannot be calculated before the soda has been consumed. Thus, this statement is incorrect. Also, looking at the graph, the amount of caffeine decreases as time (hours) passes to the right. As the hours decrease, we move to the left of the graph, and the graph is increasing. Thus, this part of the statement is true. However, part of the statement is incorrect, so we must reject it.
- Analyze the fourth statement
The fourth statement says: "The asymptote of the graph means that there will still be some amount of caffeine in the body after 30 hours." An asymptote is a line that a curve approaches but never touches. In this case, the graph approaches the x-axis (y=0) as time increases. This means that the amount of caffeine in the body gets closer and closer to zero, but it never actually reaches zero exactly (in theory). Thus, there will always be a trace amount of caffeine in the body. The statement is correct.
The asymptote of the graph means that there will still be some amount of caffeine in the body after 30 hours.
More Information
The concept of asymptotes is crucial in understanding the long-term behavior of exponential decay functions, which often model real-world phenomena like drug metabolism.
Tips
A common mistake is misinterpreting the x and y intercepts or confusing increasing and decreasing trends on the graph. Also not understanding the concept of asymptotes and their practical implications can lead to incorrectly discarding the correct option.
AI-generated content may contain errors. Please verify critical information