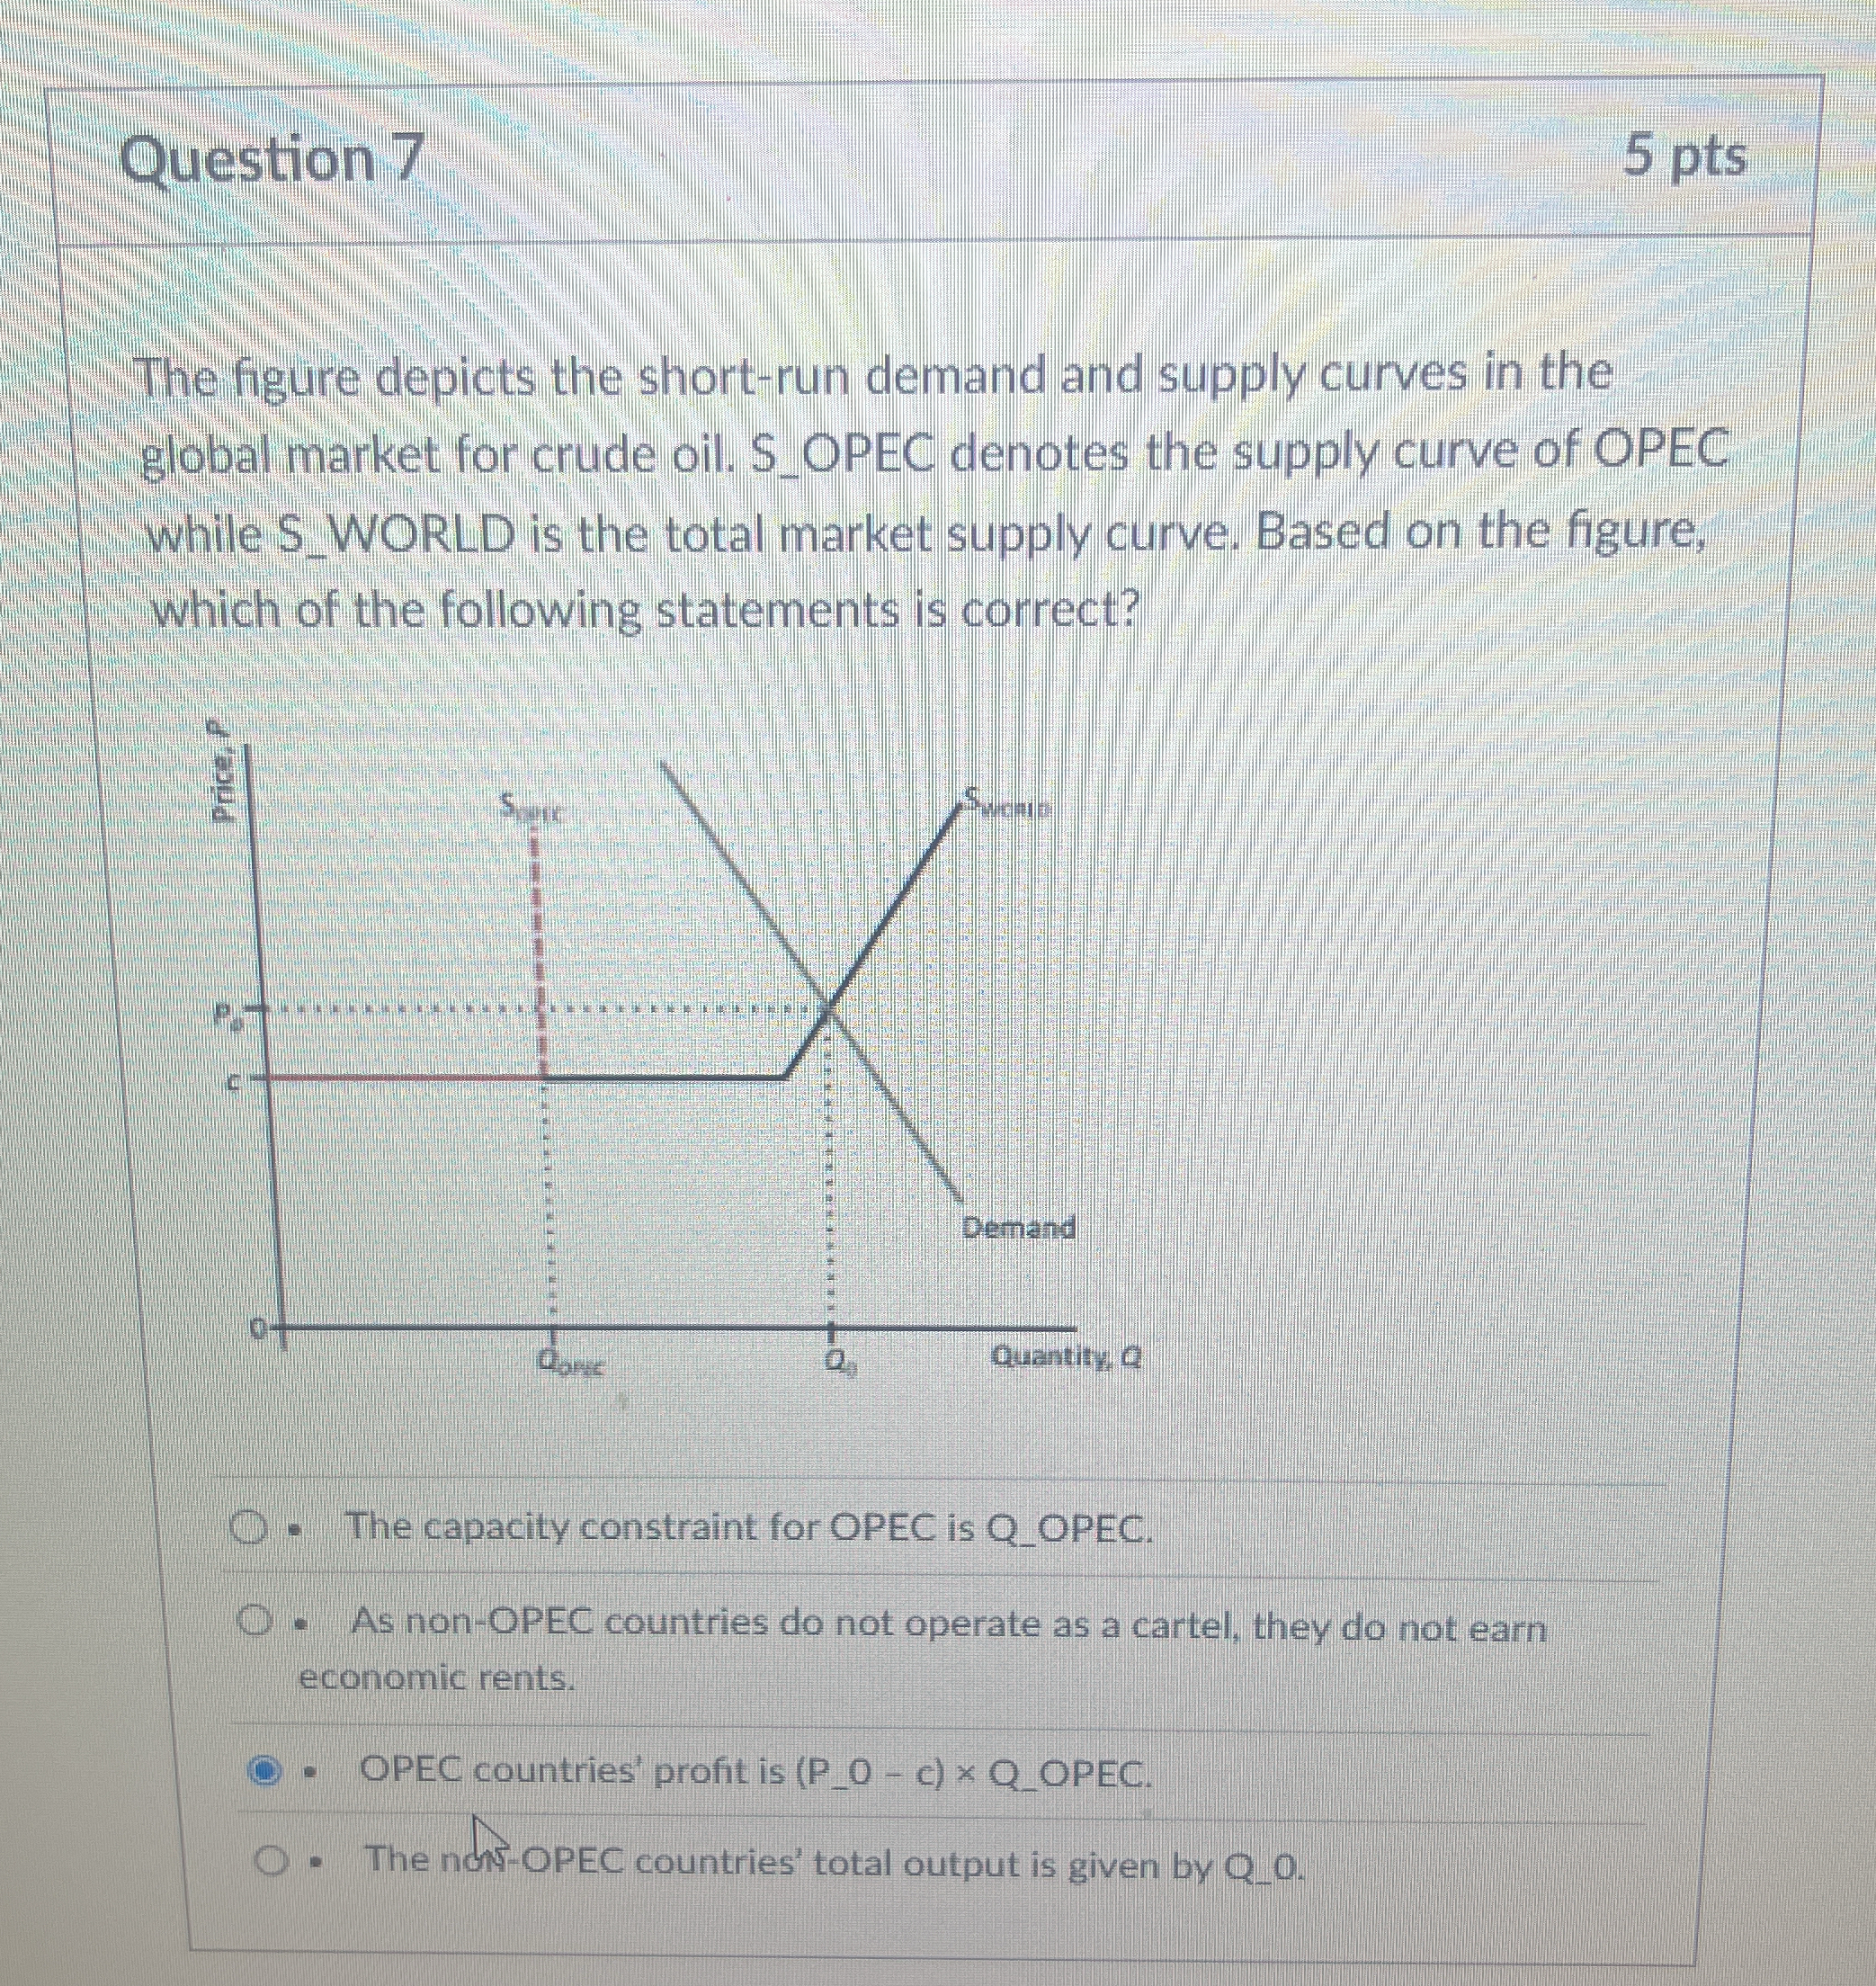
The figure depicts the short-run demand and supply curves in the global market for crude oil. S_OPEC denotes the supply curve of OPEC while S_WORLD is the total market supply curve... The figure depicts the short-run demand and supply curves in the global market for crude oil. S_OPEC denotes the supply curve of OPEC while S_WORLD is the total market supply curve. Based on the figure, which of the following statements is correct?
Understand the Problem
The question requires analyzing a supply and demand diagram for crude oil, differentiating between OPEC and the rest of the world, and determining which statement about capacity, economic rents, or profit is correct based on the diagram.
Answer
OPEC countries' profit is (P_0 - c) x Q_OPEC.
Based on the figure, OPEC countries' profit is (P_0 - c) x Q_OPEC.
Answer for screen readers
Based on the figure, OPEC countries' profit is (P_0 - c) x Q_OPEC.
More Information
OPEC's profit is calculated by multiplying the quantity they sell (Q_OPEC) by the profit margin per unit, which is the difference between the market price (P_0) and their cost per unit (c). Hence, the profit is (P_0 - c) * Q_OPEC.
Tips
Understanding how to read the graph and defining the calculation for profit helps prevent errors.
AI-generated content may contain errors. Please verify critical information