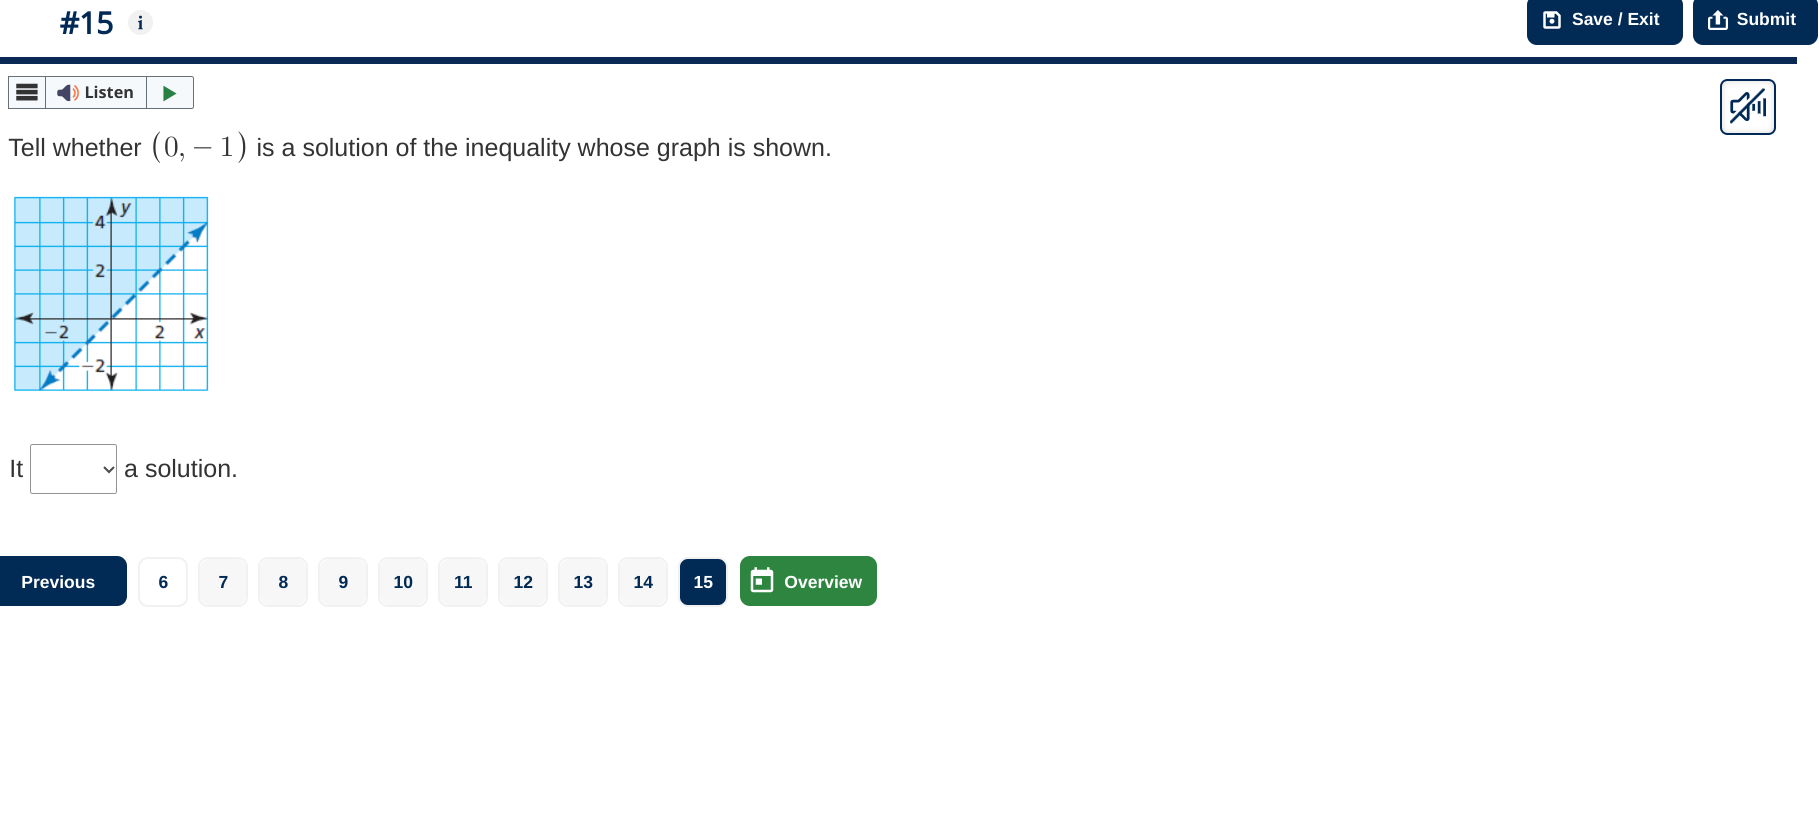
Tell whether (0, -1) is a solution of the inequality whose graph is shown.

Understand the Problem
The question is asking if the point (0, -1) is a solution to the inequality represented by the graph shown. To determine this, one would need to analyze the graph and see if this point lies within the solution region indicated by the inequality.
Answer
It is a solution.
Answer for screen readers
It is a solution.
Steps to Solve
-
Identify the Inequality from the Graph
Examine the graph to determine the equation of the line. The line appears to have a positive slope and intersects the y-axis at (0, 2). -
Determine the Equation of the Line
From the graph, the equation of the line can be represented as: $$ y = \frac{1}{2}x + 2 $$ -
Identify the Type of Inequality
Check if the line is solid or dashed. In this case, the line is dashed, indicating that the inequality is strict: $$ y < \frac{1}{2}x + 2 $$ -
Substitute the Point into the Inequality
Now, substitute the point (0, -1) into the inequality: $$ -1 < \frac{1}{2}(0) + 2 $$ -
Simplify the Inequality
Calculate the right side: $$ -1 < 2 $$
This statement is true. -
Determine if the Point is a Solution
Since the inequality holds true with the substitution of the point (0, -1), this point is indeed a solution to the inequality.
It is a solution.
More Information
The point lies below the dashed line, which indicates the area where the inequality holds true. Any point in this area is considered a solution of the inequality.
Tips
- Misinterpreting the type of line (solid vs. dashed), which can lead to incorrect inequality signs.
- Failing to properly substitute the point into the inequality, which may result in an incorrect conclusion.
AI-generated content may contain errors. Please verify critical information